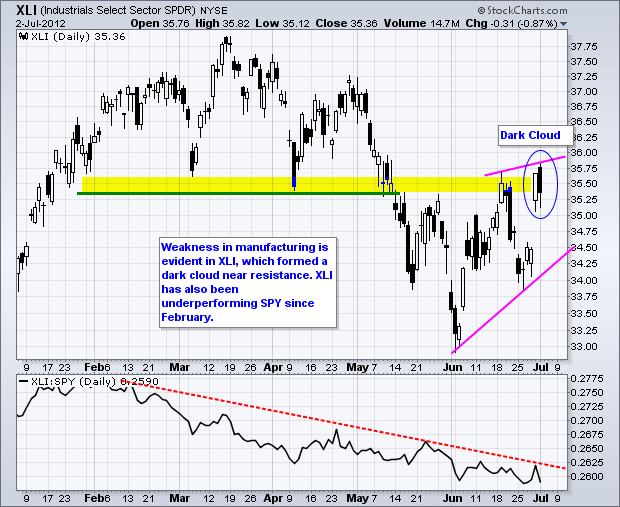
The economic news was mixed on Monday. May construction spending hit its highest level in over 2 years. A decrease in public sector construction spending was offset by an increase in private sector spending. The ISM Manufacturing Index slipped below 50 (49.7), which is the first reading below 50 since 2009. Readings below 50 indicate economic weakness. With the index at 53.5 in May, the June reading below 50 represents a pretty big decline. Moreover, it is just another key indicator that came in below expectations. Today we have Auto-Truck Sales and Factory Orders. US markets close at 1PM ET today and will be closed all day on Wednesday for July 4th. Have a happy and safe holiday!
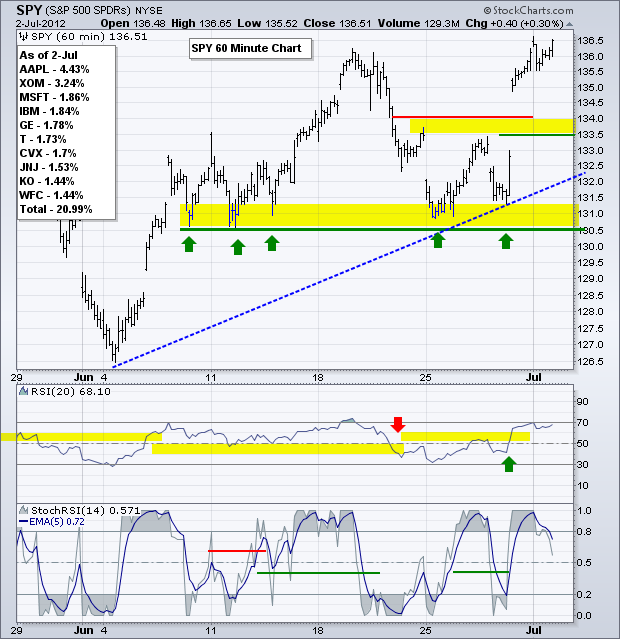
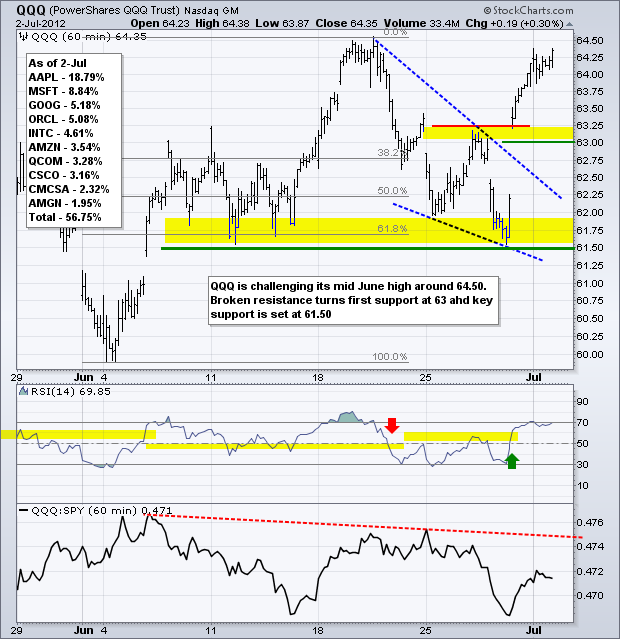
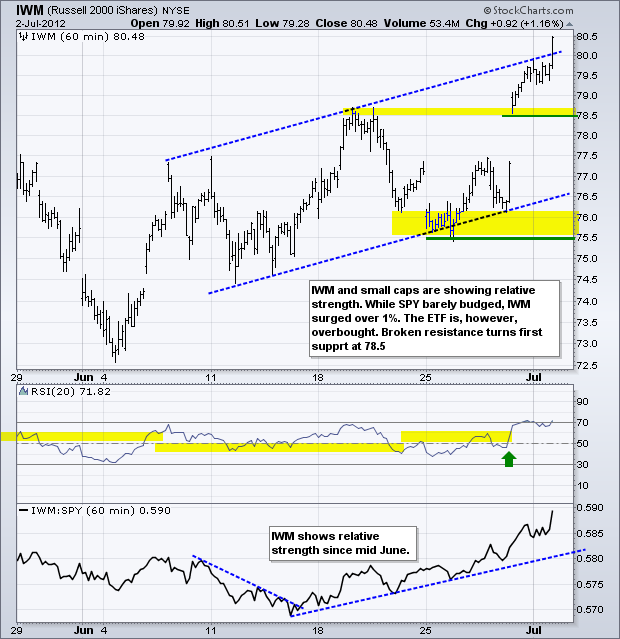
On the 60-minute chart, the S&P 500 ETF (SPY) took the negative news on manufacturing in stride by posting a small gain. Strength in the technology and finance sectors offset weakness in the industrials and materials sectors. Overall, SPY edged above is mid June highs and remains in an uptrend for four weeks now. There are two support levels to watch going forward. First, broken resistance in the 133.5-134 area turns support. A strong gap and breakout should hold. Failure to follow through and a move below 133.5 would suggest underlying weakness. Key support remains at 130.50, a level tested five times in June. A break below this level would have medium-term consequences because it would signal a continuation of the May decline.
**************************************************************************
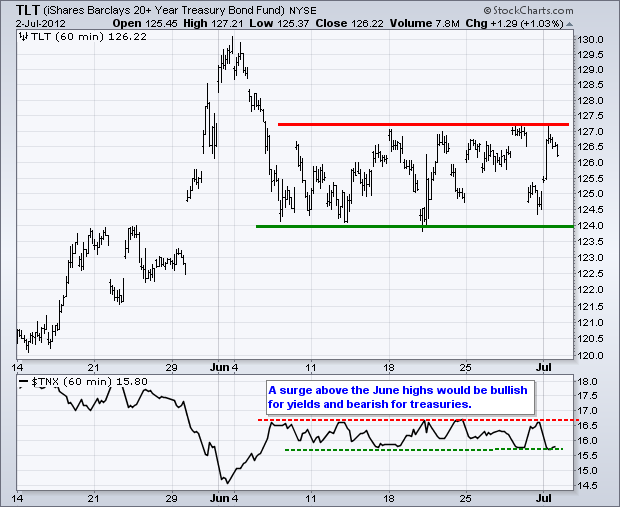
All it took was a worse-than-expected ISM Manufacturing report to push the 20+ Year T-Bond ETF (TLT) back to resistance. Support has held, but resistance has yet to be broken. A lot is riding on the economic data due this week. More worse-than-expected data would push TLT through resistance. A bullish breakout in TLT would be bearish for stocks. The 10-year Treasury Yield ($TNX) is testing support from the June lows and a break would be bullish for TLT.
**************************************************************************
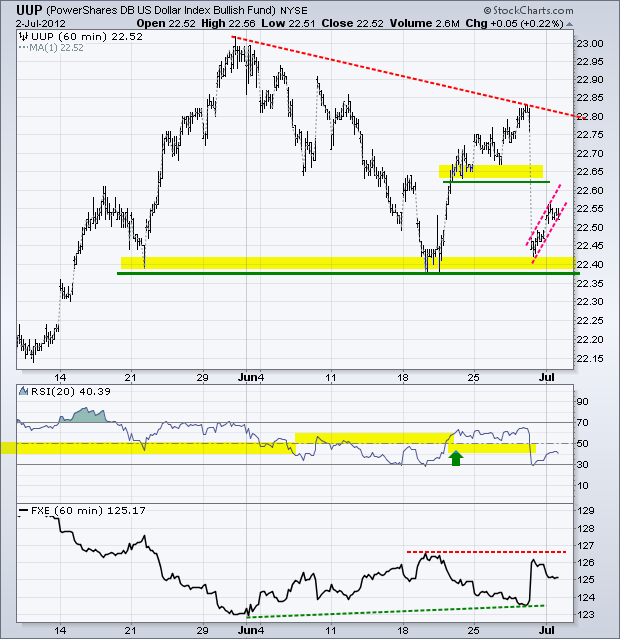
The Dollar got a bounce off support, but remains in a downtrend since late May. Notice that this downtrend in the Dollar coincides with the uptrend in stocks (negative correlation). Chancellor Merkel is already feeling the heat at home from her coalition partners over the EU summit, while Greece is looking for a better deal after seeing what Spain got. Greece will likely return to the forefront when their next debt payment is due in August. The European Central Bank (ECB) will meet this week and could actually cut rates to stimulate the economy. This would be Euro bearish, but this week's focus could be on the US economy with the jobs report on Friday. More worse-than-expected data would increase the chances of QE3 and this would be Dollar bearish.
**************************************************************************
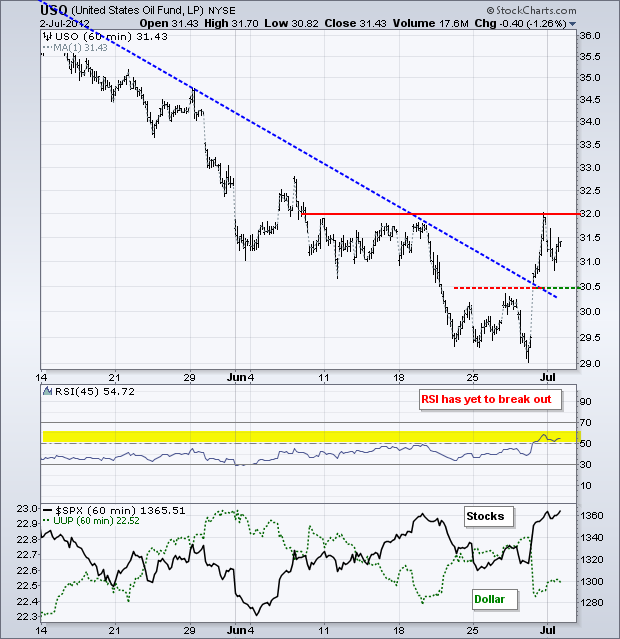
The US Oil Fund (USO) hit resistance from the mid June highs and backed off on Monday. The ETF was quite overbought after Friday's big surge. Even though the breakout at 30.50 is holding, further gains will likely depend on the Euro and the stock market because oil is part of this risk-on group. Broken resistance turns first support at 30.5.
**************************************************************************
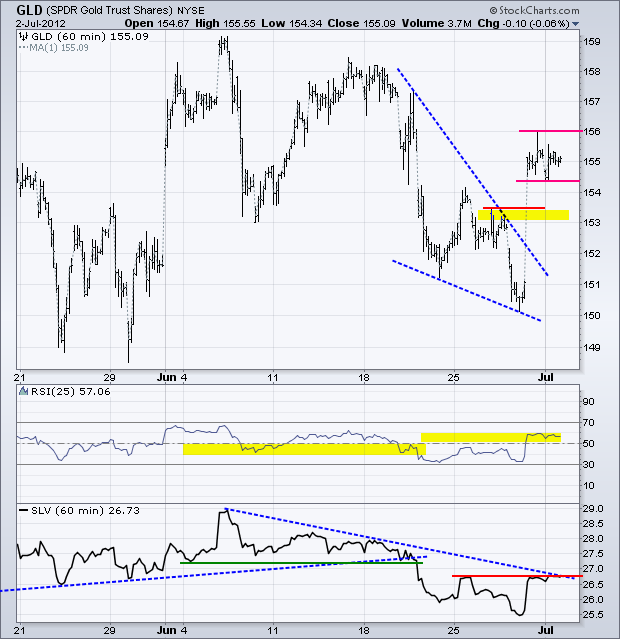
The Gold SPDR (GLD) broke resistance with a big move on Friday and then consolidated on Monday. Even though a clear pennant or flag did not take shape, this could be a bullish consolidation (rest) after the big surge. A break above 156 would signal a continuation higher and target a resistance challenge around 159. RSI is challenging resistance at 60 and a breakout would be bullish for momentum.
**************************************************************************
Key Reports and Events:
Tue - Jul 03 - 10:00 - Factory Orders
Tue - Jul 03 - 14:00 - Auto/Truck Sales
Thu - Jul 05 - 07:00 - MBA Mortgage Index
Thu - Jul 05 - 07:30 - Challenger Job Cuts
Thu - Jul 05 - 10:00 – European Central Bank Policy Statement
Thu - Jul 05 - 08:15 - ADP Employment
Thu - Jul 05 - 08:30 - Initial Claims
Thu - Jul 05 - 10:00 - ISM Services
Thu - Jul 05 - 11:00 - Oil Inventories
Fri - Jul 06 - 08:30 - Employment Report
Charts of Interest: None on Tuesday due to early close. Next on Thursday
This commentary and charts-of-interest are designed to stimulate thinking. This analysis is not a recommendation to buy, sell, hold or sell short any security (stock ETF or otherwise). We all need to think for ourselves when it comes to trading our own accounts. First, it is the only way to really learn. Second, we are the only ones responsible for our decisions. Think of these charts as food for further analysis. Before making a trade, it is important to have a plan. Plan the trade and trade the plan. Among other things, this includes setting a trigger level, a target area and a stop-loss level. It is also important to plan for three possible price movements: advance, decline or sideways. Have a plan for all three scenarios BEFORE making the trade. Consider possible holding times. And finally, look at overall market conditions and sector/industry performance.

