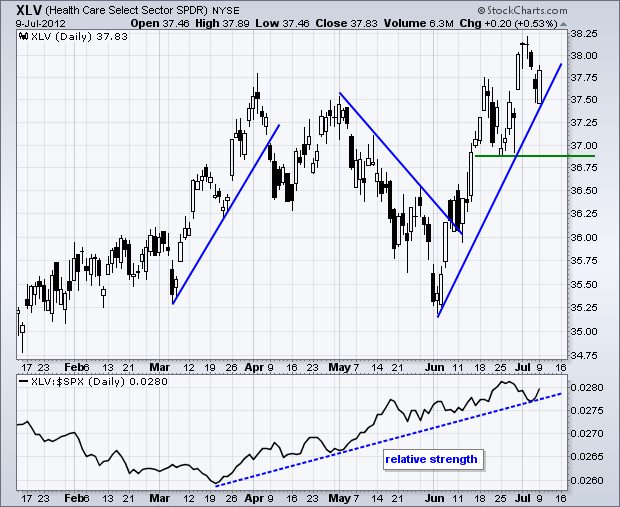
Stocks edged lower on Monday with the major index ETFs finishing slightly lower. Eight of the nine sectors were lower with the Energy SPDR (XLE) and Consumer Discretionary SPDR (XLY) leading the decline. Both were down around .5%. The Healthcare SPDR (XLV) was the lone gainer as big pharma stocks rose. XLV hit a new 52-week high last week and continues to show relative strength.
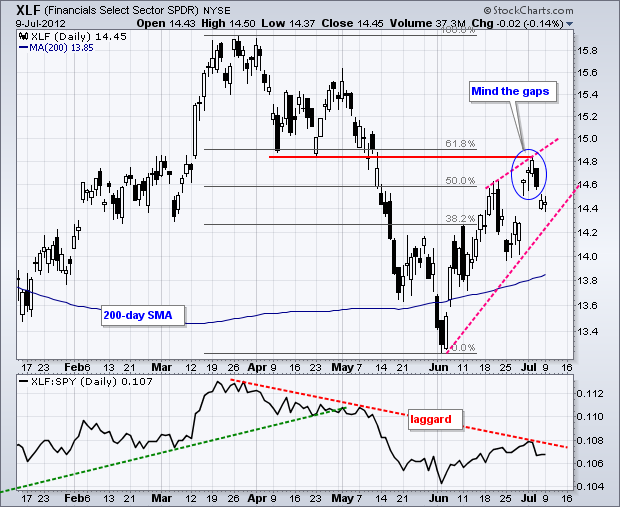
With Monday's weakness, many key ETFs remain below their gaps from Friday. The first chart shows the Finance SPDR (XLF) hitting resistance at broken support and the 61.80% retracement line. Also notice that a rising wedge formed in June. XLF peaked last week with a sharp decline on Thursday and gap down on Friday. The seven day pattern looks like an island reversal of sorts and XLF is in danger of a breakdown as long as Friday's gap holds.
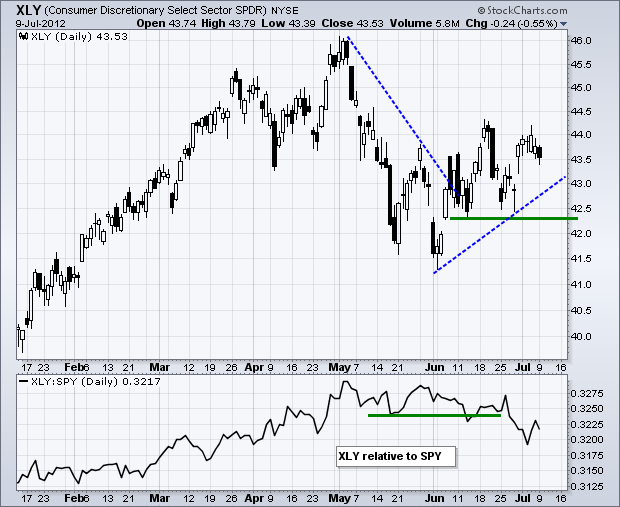
Relative weakness in the Consumer Discretionary SPDR remains a big concern. While the S&P 500 ETF zoomed above its mid June high last week, XLY fell short of breaking this high and showed relative weakness. Notice that the XLY:SPY ratio (Price Relative) peaked in early May and broke down in late June.
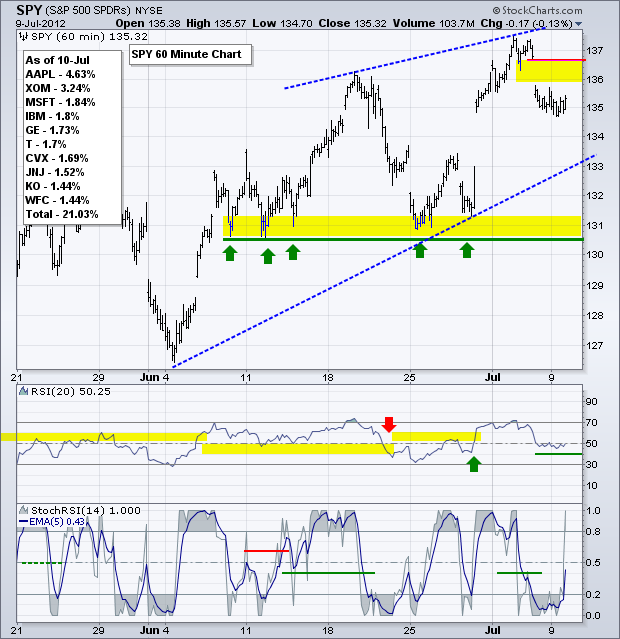
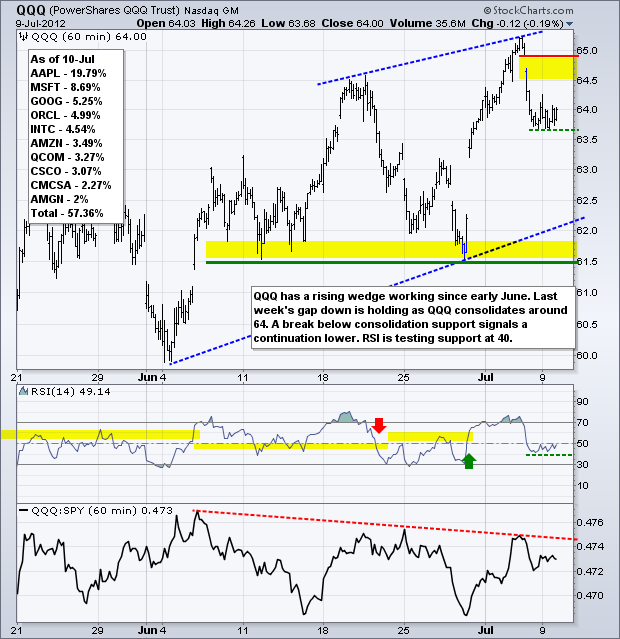
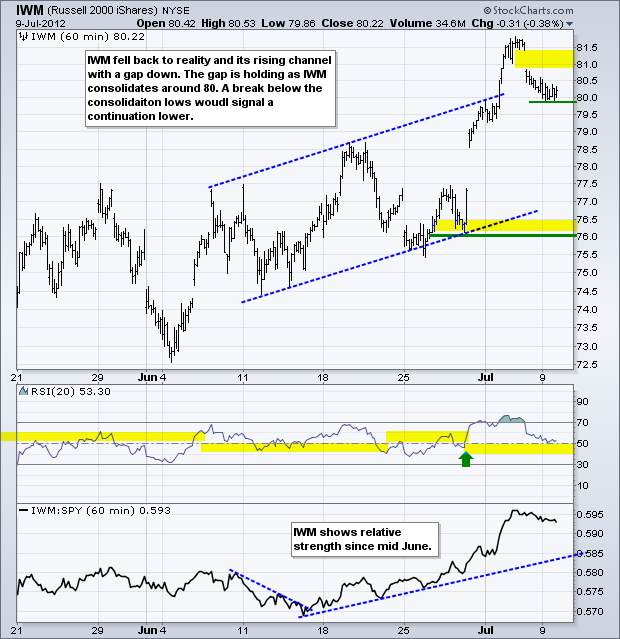
QQQ and SPY have rising wedges working since early June and the trend within these wedges appears to be down after Friday's gaps. SPY edged above its mid June high with a move above 137 last week and then gapped below 136. This is a strong gap and it is holding. I would give the short-term edge to the bears as long as the gap holds. This means we could see a move towards the next support levels. The lower trendline of the rising wedge marks support around 133 and the June lows mark support around 130.50, which is a medium-term support level as well. RSI is consolidating in the 40-50 zone and a break below 40 would turn momentum bearish.
**************************************************************************
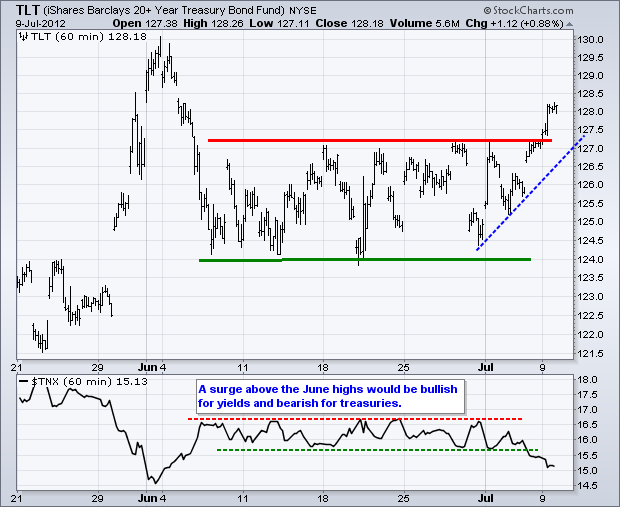
Even though US treasury bonds are clearly not undervalued and offer little yield, they continue to attract safe-haven buyers as Spanish bonds yields rise and the US economy stumbles. The 20+ Year T-Bond ETF (TLT) broke resistance with a surge above 128. The bigger trend was always up and this breakout turns the short-term trend bullish again. Also notice that the 10-year Treasury Yield ($TNX) broke support with a move lower last week. Strength in treasuries is negative for US stocks.
**************************************************************************
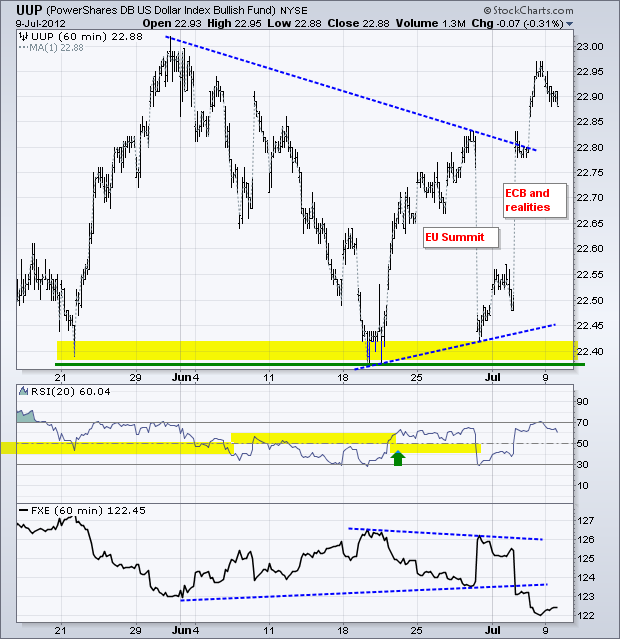
The US Dollar Fund (UUP) plunged as the Euro surged in a short-covering rally in late June, but surged back above its late June high with a reality check in early July. There was no follow through to the EU Summit. Neither the Euro nor the EU leaders followed through. It was just a grand announcement with little or no immediate action. The Euro Currency Trust (FXE) broke triangle support last week and Spanish bond yields are back near 7%. UUP broke triangle resistance and will likely exceed its prior high around 23. With stocks and the Dollar negatively correlated, this would be negative for US equities.
**************************************************************************
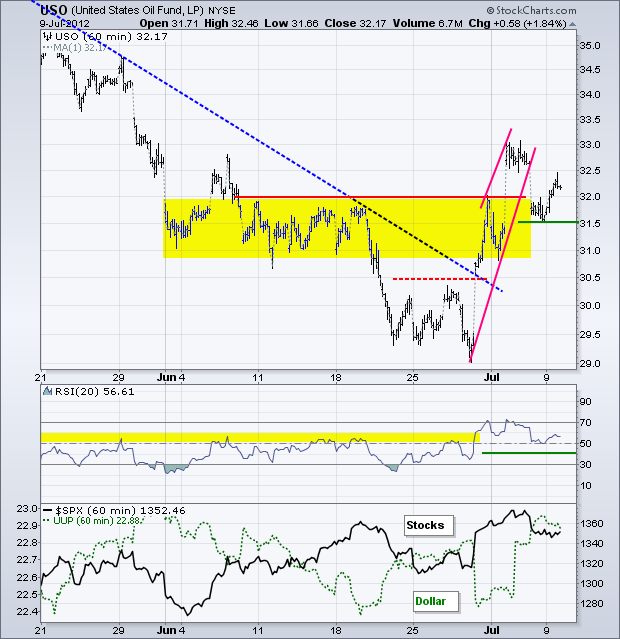
The oil market is playing the Iranian card, but may soon turn back to economics if equity markets fall. The US Oil Fund (USO) surged above resistance at 32 with a massive rally that was probably short covering. Oil followed stocks lower last week and USO broke the lower trendline of a steep rising wedge. Broken resistance turns into support in the 31.5-32 area and I am marking short-term support here. A break below 31.50 would be short-term bearish for USO.
**************************************************************************
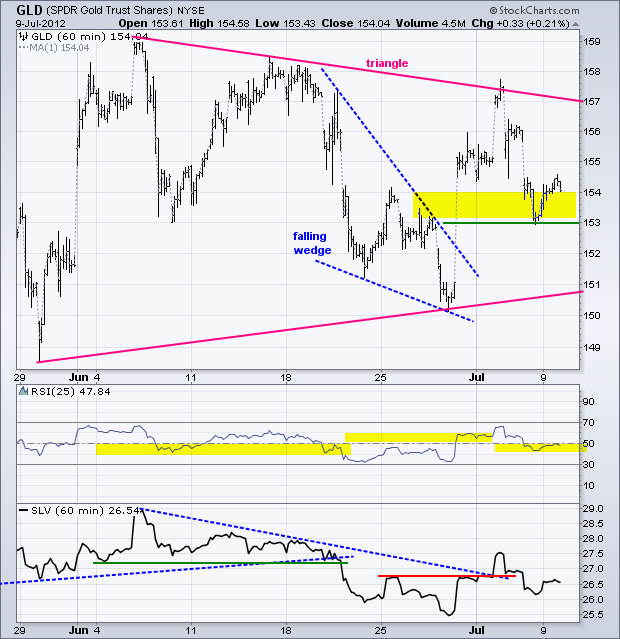
Gold is acting like a risk-on asset lately: it falls along with the stock market and Euro. Even though this may change one day, for now I consider weakness in stocks and the Euro to be bullion bearish. Overall, the Gold SPDR (GLD) is trading within a large triangle. Within the triangle, the ETF broke falling wedge resistance in late June and then fell back to the breakout. GLD is currently testing support at 153 and a break below this level would completely negate the falling wedge breakout.
**************************************************************************
Key Reports and Events:
Wed - Jul 11 - 10:30 - Oil Inventories
Wed - Jul 11 - 14:00 - FOMC Minutes
Thu - Jul 12 - 08:30 - Initial Jobless Claims
Fri - Jul 13 - 08:30 - Producer Price Index (PPI)
Fri - Jul 13 - 09:55 - Michigan Sentiment
Charts of Interest: Tuesday and Thursday
This commentary and charts-of-interest are designed to stimulate thinking. This analysis is not a recommendation to buy, sell, hold or sell short any security (stock ETF or otherwise). We all need to think for ourselves when it comes to trading our own accounts. First, it is the only way to really learn. Second, we are the only ones responsible for our decisions. Think of these charts as food for further analysis. Before making a trade, it is important to have a plan. Plan the trade and trade the plan. Among other things, this includes setting a trigger level, a target area and a stop-loss level. It is also important to plan for three possible price movements: advance, decline or sideways. Have a plan for all three scenarios BEFORE making the trade. Consider possible holding times. And finally, look at overall market conditions and sector/industry performance.

About the author:
Arthur Hill, CMT, is the Chief Technical Strategist at TrendInvestorPro.com. Focusing predominantly on US equities and ETFs, his systematic approach of identifying trend, finding signals within the trend, and setting key price levels has made him an esteemed market technician. Arthur has written articles for numerous financial publications including Barrons and Stocks & Commodities Magazine. In addition to his Chartered Market Technician (CMT) designation, he holds an MBA from the Cass Business School at City University in London.
Learn More
