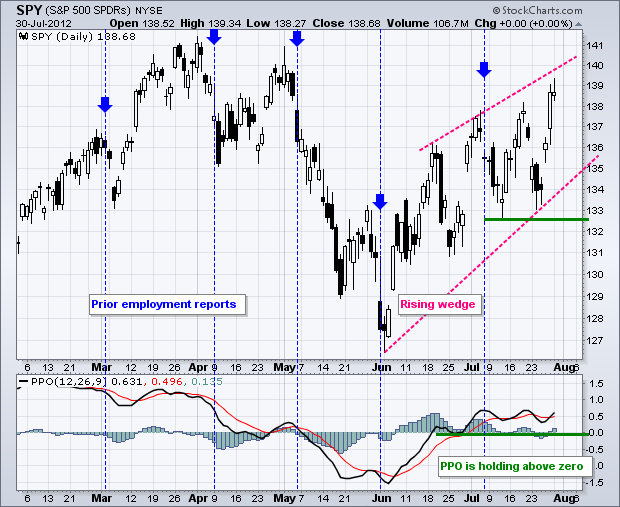
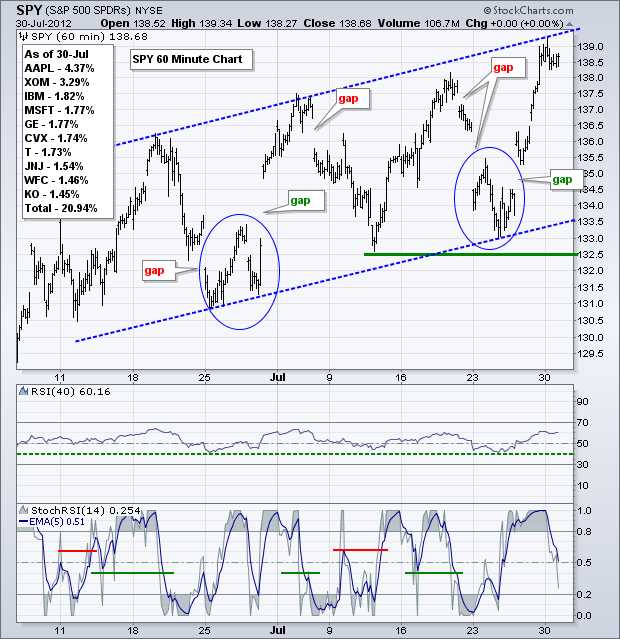
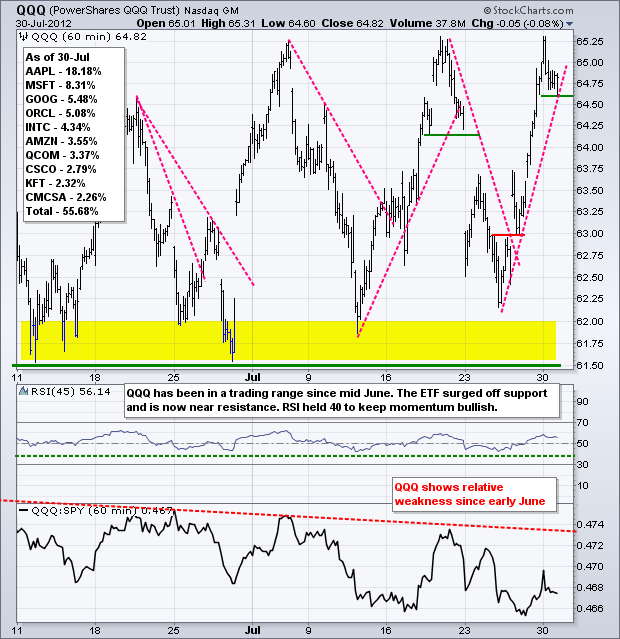
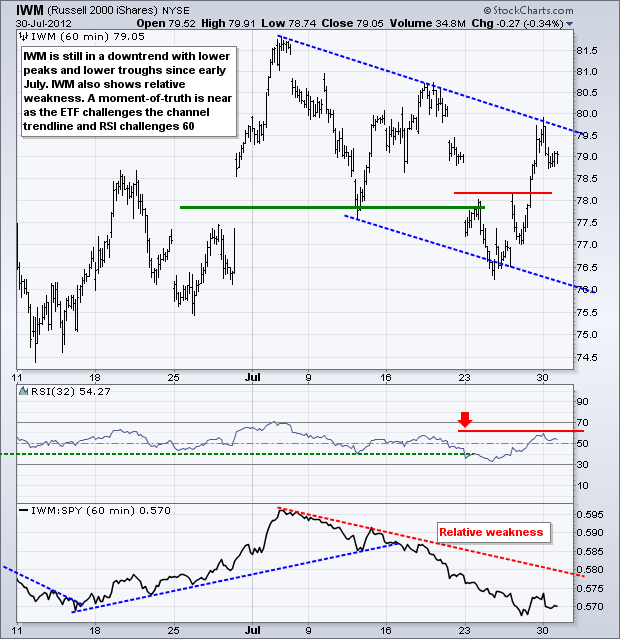
Stocks edged lower on Monday in listless trading. The Russell 2000 ETF (IWM) led the way down with a .64% loss, while the Nasdaq 100 ETF (QQQ) held most of its ground with a fractional .11% loss. Sector action was mixed with technology, energy, consumer staples and utilities slightly higher. Consumer discretionary, finance, industrials and materials moved slightly lower. This indecisiveness produced candlesticks with little change from open to close on many charts. The chart below shows the S&P 500 ETF (SPY) stalling with a candlestick similar to those that marked the previous two July peaks. Medium-term, the trend is up with key support set at 132.5 and PPO support at zero.
**************************************************************************
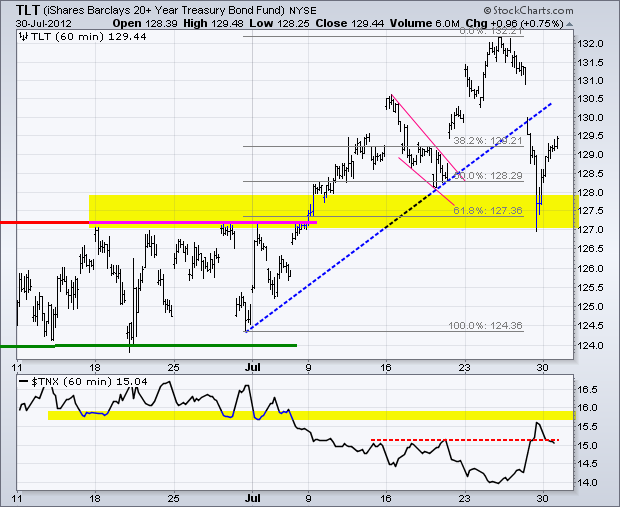
Treasuries will be at the mercy of this week's economic reports and the FOMC meeting. Signs of economic weakness would be bullish, while signs of economic strength would be bearish. Keep in mind that the medium-term and long-term trends are up for treasuries. On the price chart, the 20+ Year T-Bond ETF (TLT) broke down last week, but bounced off broken resistance and the 61.80% retracement line. The yellow zone marks a key area to watch. A break below this zone would be bearish for treasuries and bullish for equities.
**************************************************************************
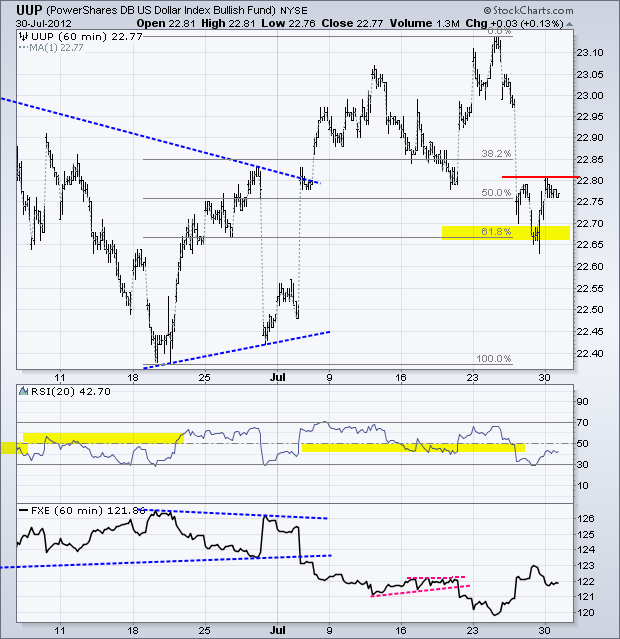
The Dollar will be in the spotlight this week with a slew of economic reports hitting the fan and the FOMC policy statement on Wednesday. UUP plunged after Drahgi saved the Euro, at least in theory, last week. A promise made is a debt unpaid so the European Central Bank (ECB) better deliver. The US Dollar Fund (UUP) is firming near the 61.80% retracement and establishing minor resistance with Monday's high.
**************************************************************************
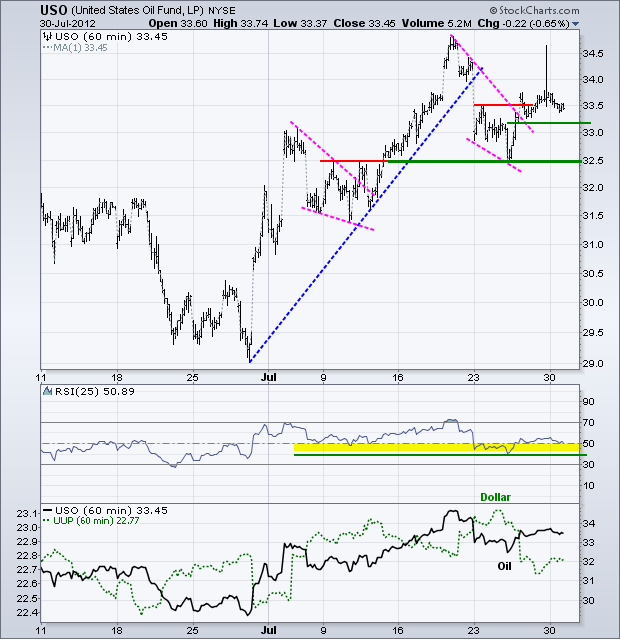
No change. The US Oil Fund (USO) broke falling wedge resistance, but did not surge with the stock market on Friday. The inability to rise along with stocks and the Euro could be a negative. The falling wedge breakout is holding for now. I am marking key support at 32.5 and RSI support at 40. These two levels hold the key to the current uptrend.
**************************************************************************
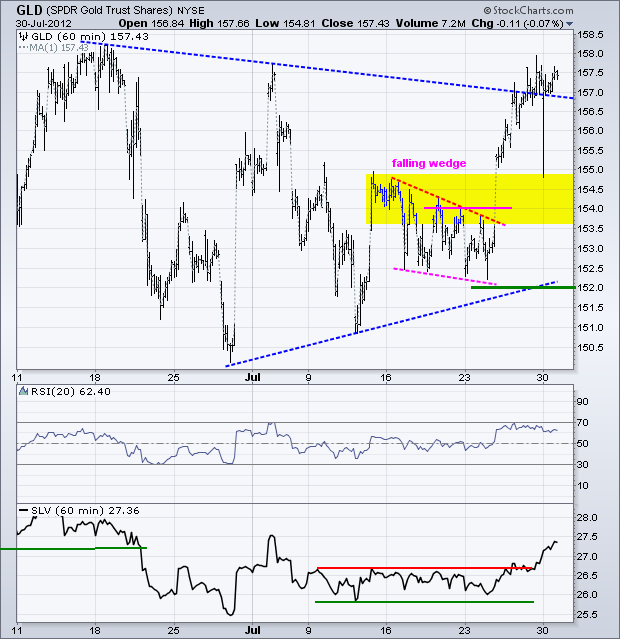
No change. Strength in the Euro and stock market carried over to gold as the Gold SPDR (GLD) surged above the triangle trend line. The gap and wedge breakout held. More importantly, GLD followed through on this breakout. The gap zone and breakout mark the first support zone to watch. A move back below 153.5 would negate this move. Key support remains at 152 for now.
**************************************************************************
Key Reports and Events:
Tue - Jul 31 - 08:30 - Personal Income & Spending
Tue - Jul 31 - 09:00 - Case-Shiller Housing Index
Tue - Jul 31 - 09:00 – FOMC Meeting Begins
Tue - Jul 31 - 09:45 - Chicago Purchasing Managers Index (PMI)
Tue - Jul 31 - 10:00 - Consumer Confidence
Wed - Aug 01 - 07:00 - MBA Mortgage Index
Wed - Aug 01 - 08:15 - ADP Employment Report
Wed - Aug 01 - 10:00 - ISM Manufacturing Index
Wed - Aug 01 - 10:00 - Construction Spending
Wed - Aug 01 - 10:30 - Crude Inventories
Wed - Aug 01 - 14:00 - Auto/Truck Sales
Wed – Aug 01 - 12:30 – FOMC Policy Statement
Thu - Aug 02 - 07:30 - Challenger Job Cuts
Thu - Aug 02 - 08:30 - Jobless Claims
Thu - Aug 02 - 10:00 - Factory Orders
Thu - Aug 02 - 10:00 – European Central Bank (ECB) Meeting
Fri - Aug 03 - 10:00 - ISM Services Index
Fri – Aug 03 - 08:30 – Employment Report
Fri – Aug 31 – 09:00 – Jackson Hole Central Bank Symposium
Charts of Interest: Tuesday and Thursday
This commentary and charts-of-interest are designed to stimulate thinking. This analysis is not a recommendation to buy, sell, hold or sell short any security (stock ETF or otherwise). We all need to think for ourselves when it comes to trading our own accounts. First, it is the only way to really learn. Second, we are the only ones responsible for our decisions. Think of these charts as food for further analysis. Before making a trade, it is important to have a plan. Plan the trade and trade the plan. Among other things, this includes setting a trigger level, a target area and a stop-loss level. It is also important to plan for three possible price movements: advance, decline or sideways. Have a plan for all three scenarios BEFORE making the trade. Consider possible holding times. And finally, look at overall market conditions and sector/industry performance.

