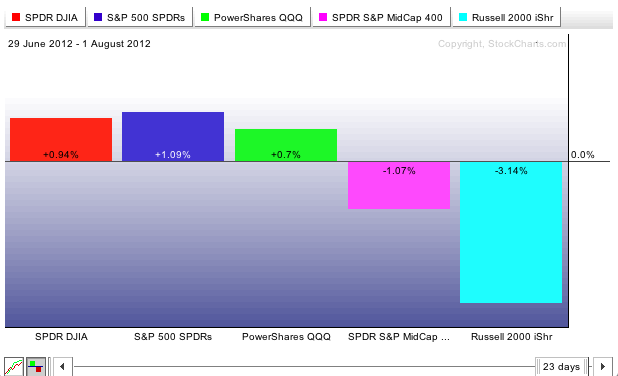
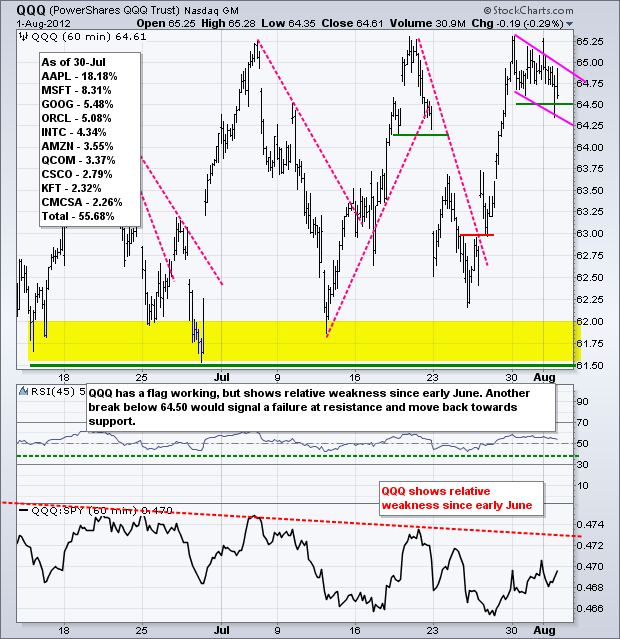
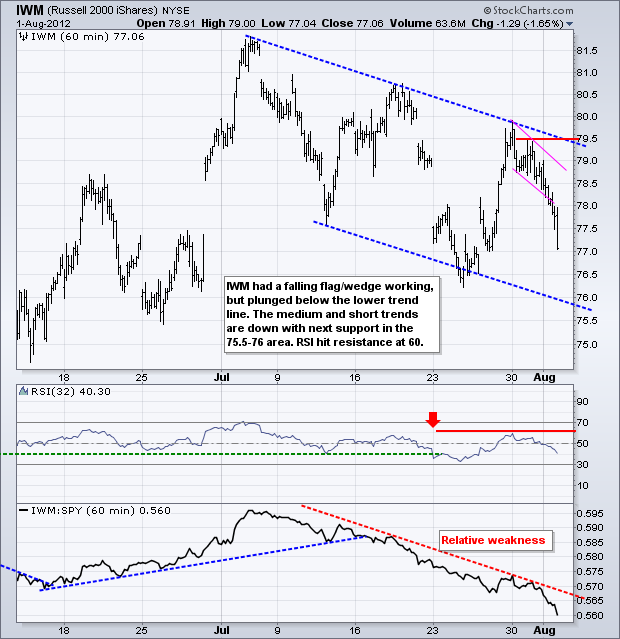
The S&P 500 ETF (-.36%) and Dow Industrials SPDR (-.19%) edged lower on Wednesday, but the Russell 2000 ETF (-1.65%) and S&P MidCap 400 SPDR (1.05%) moved decisively lower. Again, relative weakness in small-caps and mid-caps remains a major concern in the market right now. The sector PerfChart shows DIA, SPY and QQQ with gains over the past month, but IWM and MDY have losses. Clearly, something has to give here.
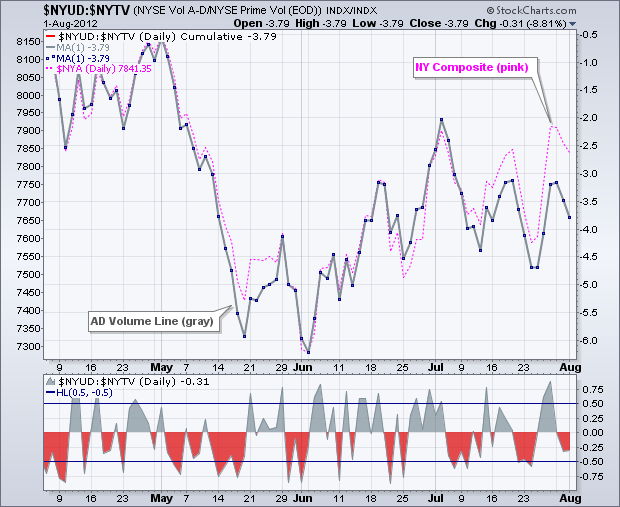
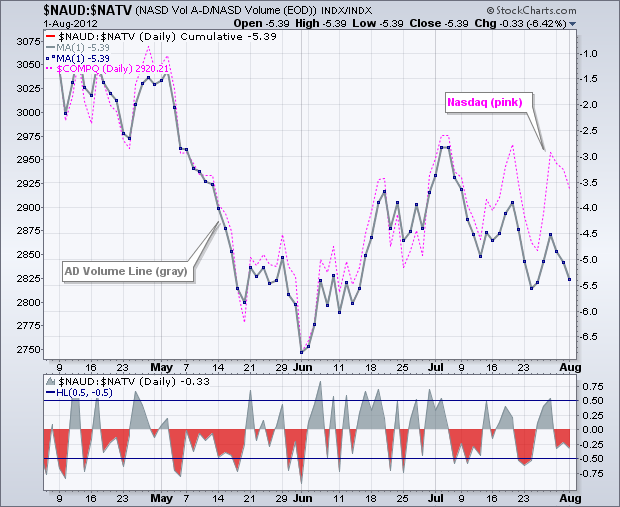
I am also concerned with short-term deterioration in the AD Volume Lines. While the NY Composite ($NYA) edged above its mid July highs, the AD Volume Line formed a lower low in late July and a lower high last week. The Nasdaq peaked in early July and zigzagged lower the last five weeks. The AD Volume Line also moved lower, but the decline was sharper. Both AD Volume Lines are trending lower with resistance levels at last week's high. A break above these highs would turn them bullish again.
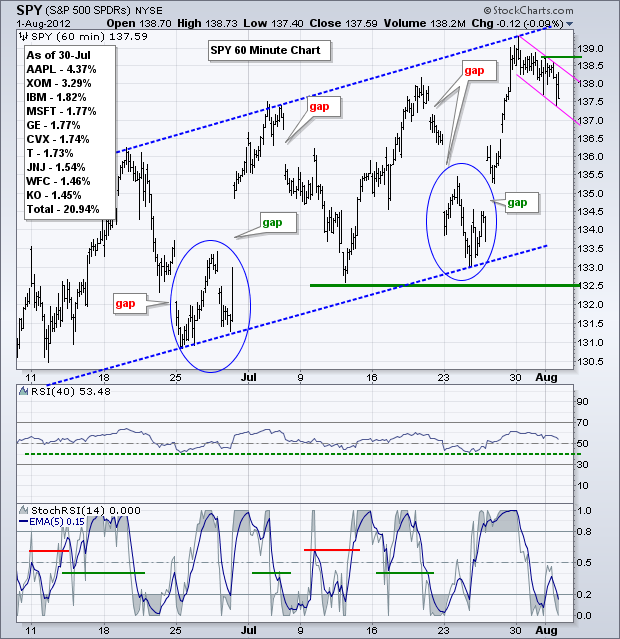
Two days to go and two more big events. The European Central Bank (ECB) meets today and we will see just how far Mario Draghi will go. The employment report is Friday. Disappointments from both would send stocks sharply lower. Better-than-expected news would likely send stocks higher. On the 60-minute chart, the S&P 500 ETF (SPY) remains in a medium-term uptrend and a short-term downtrend marked by a falling flag. The ETF closed weak on Wednesday and I am marking first resistance at 138.8. A break above this level would signal a continuation of last week's surge. Barring a breakout, relative weakness in small-caps could pull this large-cap ETF lower.
**************************************************************************
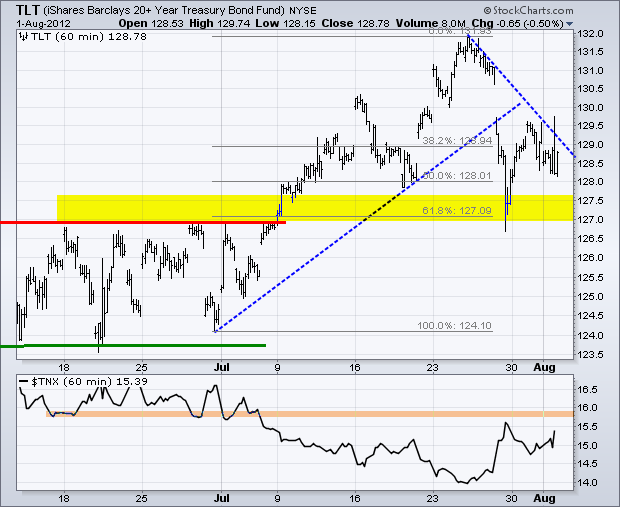
It was a wild ride in the treasury market and it promises to be wild for another two days. The 20+ Year T-Bond ETF (TLT) remains in a medium-term uptrend and broken resistance turned into support in the 127 area. I would expect TLT to move higher from here and continue its bigger uptrend. A move below support at 127 would signal a flight from safety that would be bullish for stocks and oil.
**************************************************************************
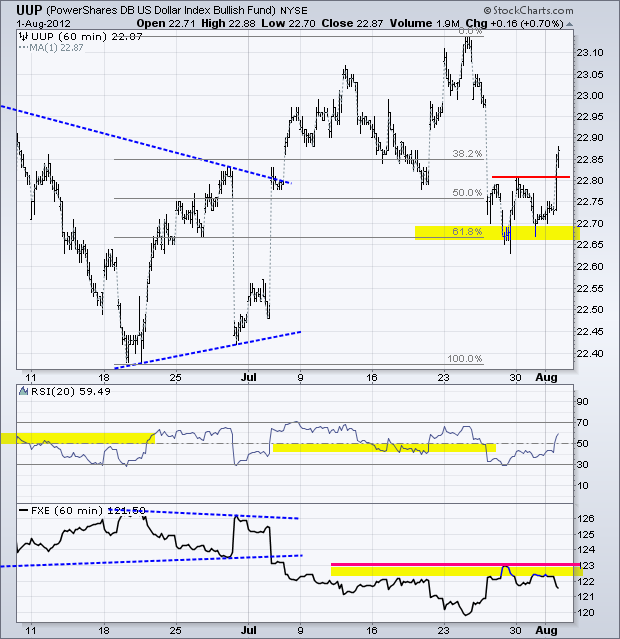
The Fed did not offer any hints of quantitative easing or extend the end-date for its low-rate policy. This does not mean tightening is around the corner, but it does show a certain reluctance. Chairman Bernanke is probably waiting for the employment report. The US Dollar Fund (UUP) held the 61.80% retracement and broke above short-term resistance with a surge on Wednesday. The Euro Currency Trust (FXE) also failed at resistance (123).
**************************************************************************
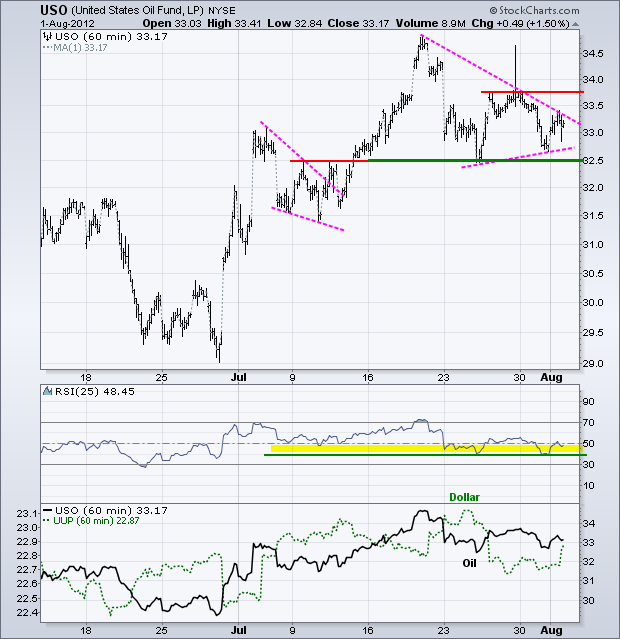
Oil is just as confused as the stock market. The US Oil Fund (USO) surged in early July and then consolidated the last two weeks. A triangle formed with resistance at 33.8 and support at 32.50. RSI is testing its support zone in the 40-50 area. A lot will depend on the Euro and the stock market. A rise in both would favor the risk-on trade and push money into oil and gold. A decline in both would favor the risk-off trade.
**************************************************************************
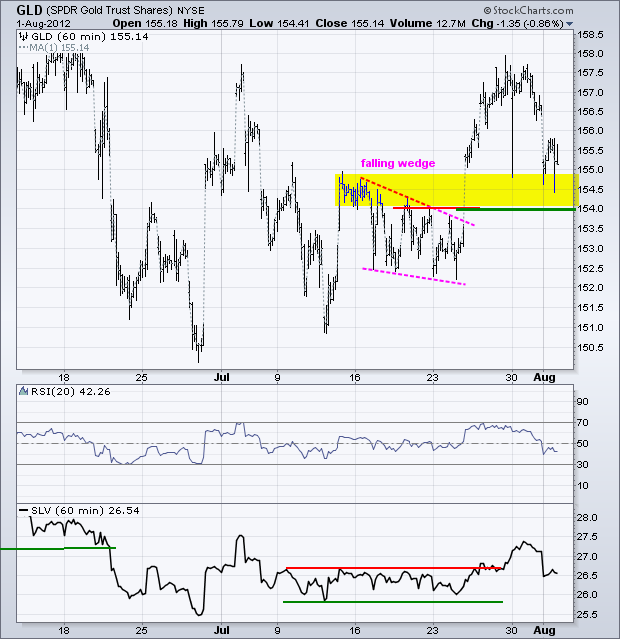
Gold was clearly disappointed with the Fed statement and the Gold SPDR (GLD) fell back below 156. Keep in mind that gold has been trending lower since August and in a consolidation since late May. The June-July highs mark a major resistance level in the 158-159 area. On the 60-minute chart, GLD fell back to the broken resistance zone for the first test. A move below 154 would negate this breakout.
**************************************************************************
Key Reports and Events:
Thu - Aug 02 - 07:30 - Challenger Job Cuts
Thu - Aug 02 - 08:30 - Jobless Claims
Thu - Aug 02 - 10:00 - Factory Orders
Thu - Aug 02 - 10:00 – European Central Bank (ECB) Meeting
Fri - Aug 03 - 10:00 - ISM Services Index
Fri – Aug 03 - 08:30 – Employment Report
Fri – Aug 31 – 09:00 – Jackson Hole Central Bank Symposium
Charts of Interest: Tuesday and Thursday
This commentary and charts-of-interest are designed to stimulate thinking. This analysis is not a recommendation to buy, sell, hold or sell short any security (stock ETF or otherwise). We all need to think for ourselves when it comes to trading our own accounts. First, it is the only way to really learn. Second, we are the only ones responsible for our decisions. Think of these charts as food for further analysis. Before making a trade, it is important to have a plan. Plan the trade and trade the plan. Among other things, this includes setting a trigger level, a target area and a stop-loss level. It is also important to plan for three possible price movements: advance, decline or sideways. Have a plan for all three scenarios BEFORE making the trade. Consider possible holding times. And finally, look at overall market conditions and sector/industry performance.

About the author:
Arthur Hill, CMT, is the Chief Technical Strategist at TrendInvestorPro.com. Focusing predominantly on US equities and ETFs, his systematic approach of identifying trend, finding signals within the trend, and setting key price levels has made him an esteemed market technician. Arthur has written articles for numerous financial publications including Barrons and Stocks & Commodities Magazine. In addition to his Chartered Market Technician (CMT) designation, he holds an MBA from the Cass Business School at City University in London.
Learn More
