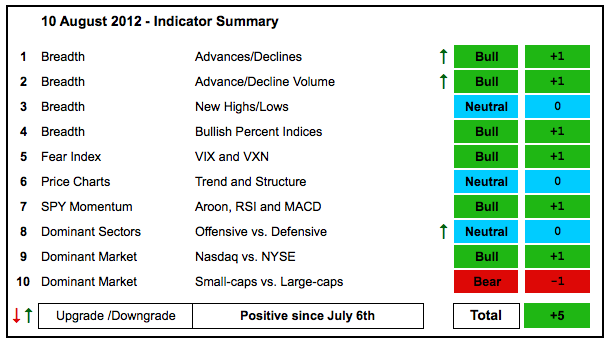
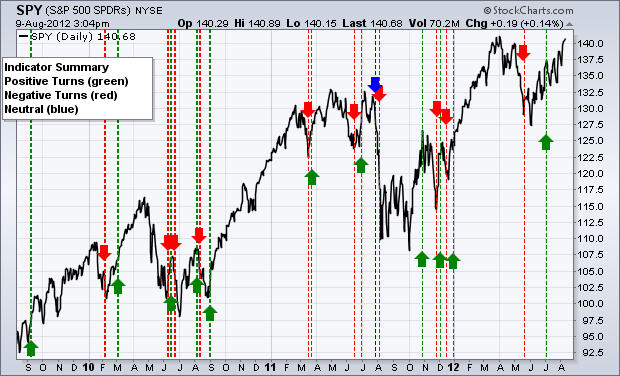
With last Friday's surge and continued strength this week, the indicator summary improved as three groups were upgraded. I upgraded the AD Lined because the NYSE AD Line hit a new high. The AD Volume Lines were upgraded because they broke their mid July highs. The offensive/defensive sector group was upgraded because the technology and industrial sectors are showing relative strength. There are still pockets of concern with relative weakness in small-caps, the consumer discretionary sector and the finance sector, but the evidence remains bullish on balance.
- AD Lines: Bullish. The Nasdaq AD Line continues to lag and remains well below its early July high. The NYSE AD Line moved above its July high to record a new 52-week high. I cannot ignore such strength and will upgrade this pair to bullish.
- AD Volume Lines: Bullish. The NYSE and Nasdaq AD Volume Lines broke above their mid July highs. Even though both remain below their early July highs, I will treat this breakout as bullish as long as the July lows hold.
- Net New Highs: Bullish. Nasdaq Net New Highs are slightly positive and the cumulative line moved above its 10-day EMA. NYSE Net New Highs remain firmly positive and the cumulative line is above its 10-day EMA.
- Bullish Percent Indices: Bullish. All nine sector BPIs are above 50%. The Technology Bullish% Index ($BPINFO) was the last hold out and crossed above 50% last week.
- VIX/VXN: Bullish. The Nasdaq 100 Volatility Index ($VXN) and the CBOE Volatility Index ($VIX) are in clear downtrends as they approach their March lows. Low volatility shows little fear in the market and this creates a positive environment for the bulls.
- Trend-Structure: Bullish. SPY and DIA continue to lead the pack as they close in on their spring highs. QQQ broke out last Friday. IWM and MDY are still lagging overall, but both broke resistance with surges this week.
- SPY Momentum: Bullish. MACD (5,35,5) and Aroon remain in positive territory. RSI moved above 60.
- Offensive Sector Performance: Neutral. The consumer discretionary and finance sectors are still dragging their feet and underperforming, but this is offset by relative strength in the technology and industrials sectors.
- Nasdaq Performance: Bullish. The $COMPQ:$NYA ratio has been flat since April, but has yet to break down and moved higher the last two weeks.
- Small-cap Performance: Bearish. The $RUT:$OEX ratio plunged in July as small-caps seriously underperformed large-caps. Even though the ratio rebounded in August, the trend is down since February.
- Breadth Charts (here) and Inter-market charts (here) have been updated.
This table is designed to offer an objective look at current market conditions. It does not aim to pick tops or bottoms. Instead, it seeks to identify noticeable shifts in buying and selling pressure. With 10 indicator groups, the medium-term evidence is unlikely to change drastically overnight.
Previous turns include:
Positive on 6-July-12
Negative on 18-May-12
Positive on 30-December-11
Negative on 16-December-11
Positive on 3-December-11
Negative on 23-November-11
Positive on 28-October-11
Negative on 5-August-11
Neutral on 29-Jul-11
Positive on 30-Jun-11
Negative on 17-Jun-11
Positive on 25-Mar-11
Negative on 18-Mar-11
Positive on 3-Sep-10
Negative on 13-Aug-10
Positive on 6-Aug-10
Negative on 24-Jun-10
Positive on 18-Jun-10
Negative on 11-Jun-10
Positive on 5-March-10
Negative on 5-Feb-10
Positive on 11-Sept-09


