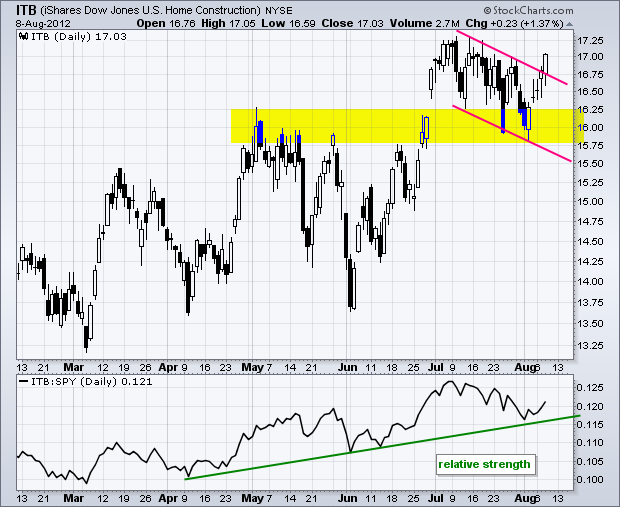
Stocks turned indecisive on Wednesday as the major index ETFs closed mixed. The Dow Industrials SPDR (DIA) edged .13% lower, while the S&P 500 ETF (SPY) edged .12% higher. The sectors were also mixed with the Consumer Discretionary SPDR (XLY) losing .49% and the Consumer Staples SPDR (XLP) advancing .79%. Within the consumer discretionary sector, the Home Construction iShares (ITB) caught a bid and surged 1.37%. ITB moved lower last week with a falling flag taking shape. ITB found support near broken resistance and broke above the flag trend line with a two day surge. The July-August lows now mark key support.
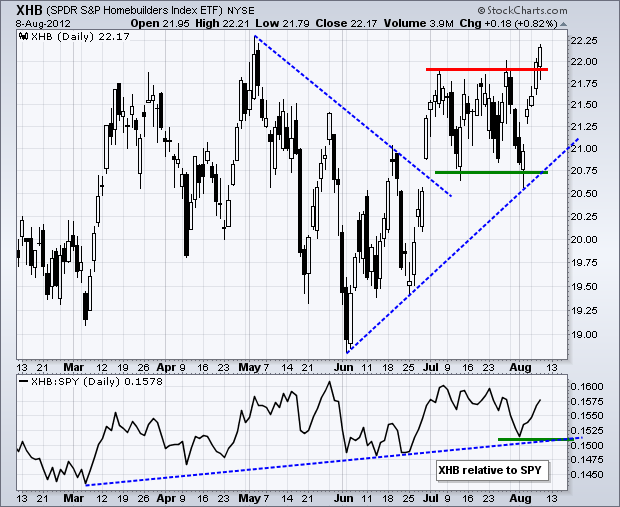
The Homebuilders SPDR (XHB) followed suit with a break above its July high. XHB is now poised to challenge its May high and might be ready to start outperforming again. The July-August lows now mark key support.
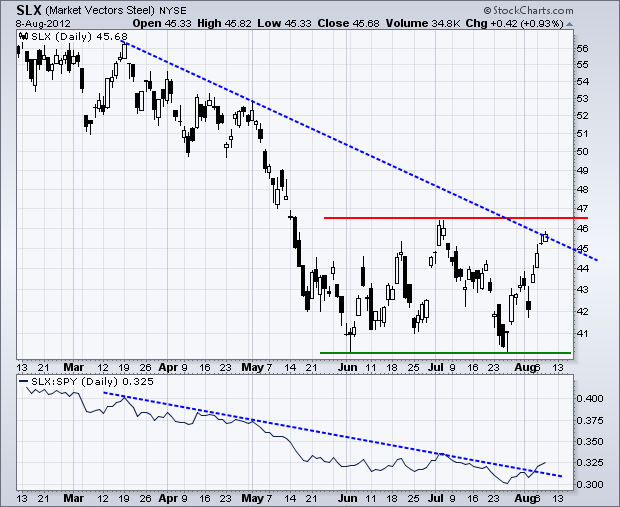
There are even signs of strength in the beaten down steel group. The Steel ETF (SLX) surged off its June low and could be forming a double bottom. I am very hesitant to speculate on a double bottom in a downtrend because there are usually a few false double bottoms before the real one. A break above the July high would confirm the double bottom and reverse the downtrend.
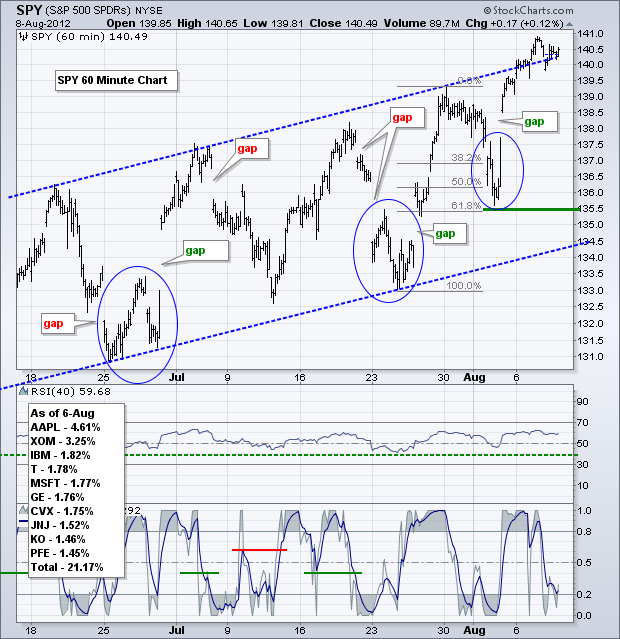
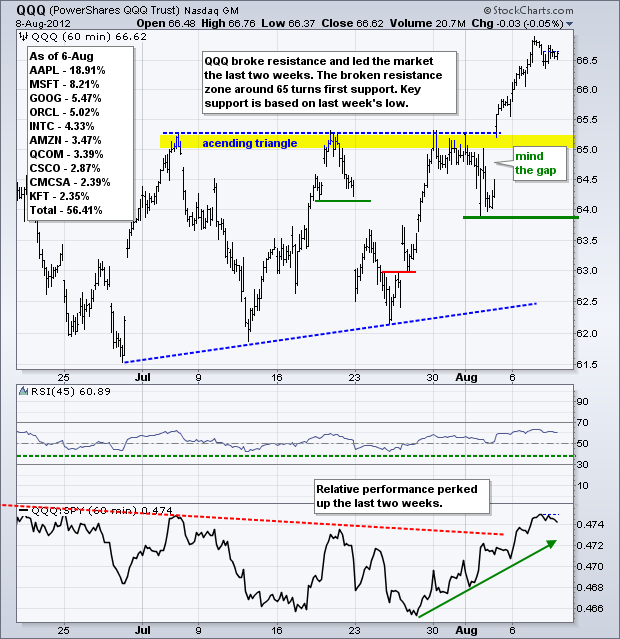
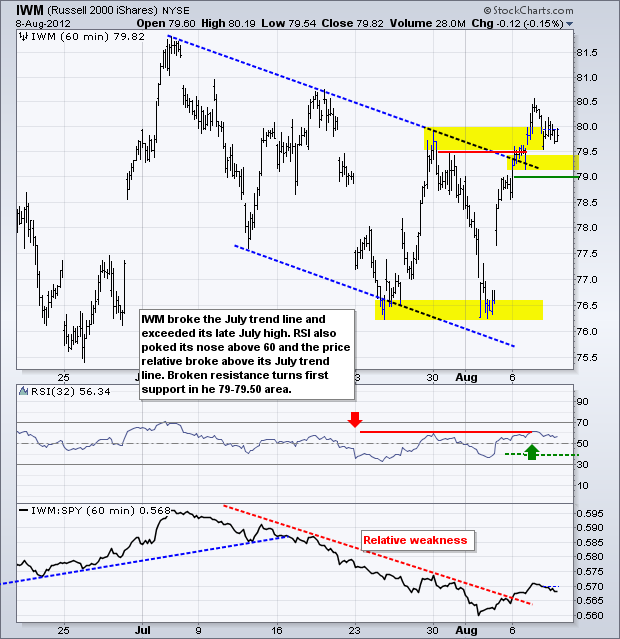
There is no change on the 60-minute chart for the S&P 500 ETF (SPY). The trend remains up since mid June with each low punctuated by a gap higher. Actually, the most recent gap occurred above the lower trend line of the rising channel as buying pressure stepped in earlier. With this week's move above 140, SPY exceeded the upper trend line of the rising channel and became a bit overbought. This does not weaken the trend, but it does increase the chances for a consolidation or pullback.
**************************************************************************
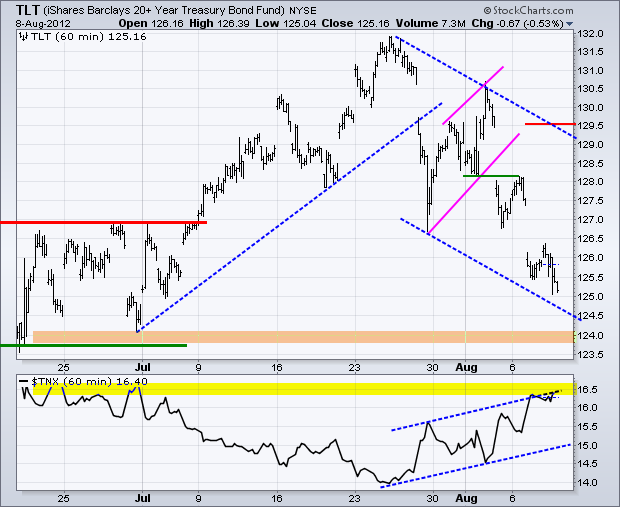
The 20+ Year T-Bond ETF (TLT) continued lower and is approaching the lower trend line of a falling channel. I drew the upper trend line first and then placed the lower trend line parallel from the late July low. This marks possible support, as do the June lows in he 124 area. With TLT as oversold as stocks are overbought, the odds of a bounce or consolidation are increasing.
**************************************************************************
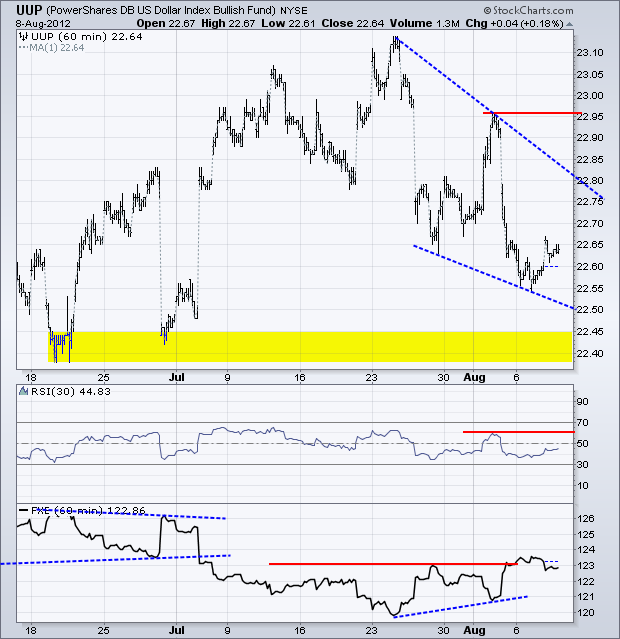
The Dollar firmed on Tuesday and got a small bounce on Wednesday. Overall, the medium-term and long-term trends are up. Short-term, a falling wedge is taking shape and the ETF became short-term oversold on Monday. Failure to hold this bounce would be negative and we could then see a continuation towards support in the 22.40 area.
**************************************************************************
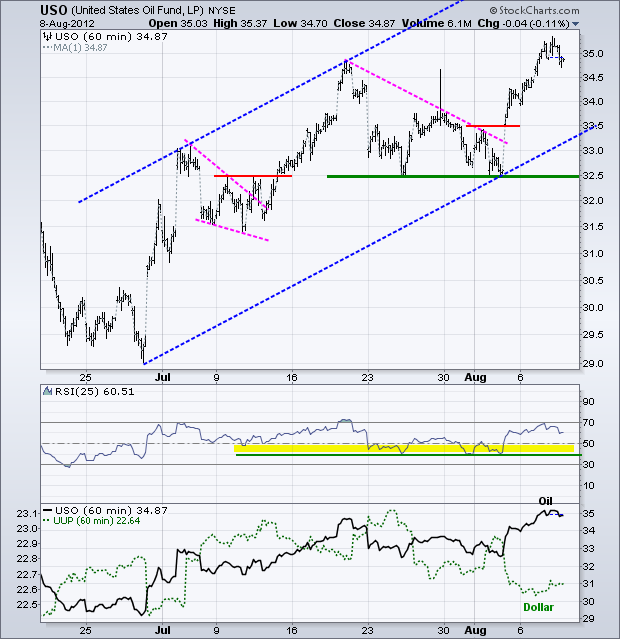
No change. Strength in stocks is bullish for oil and the US Oil Fund (USO) added to its gains this week. The ETF broke resistance with a big surge early Friday and continued higher. The trend since late June is up as oil contributes to the risk on trade. I am marking key support at 32.50 and RSI support at 40.
**************************************************************************
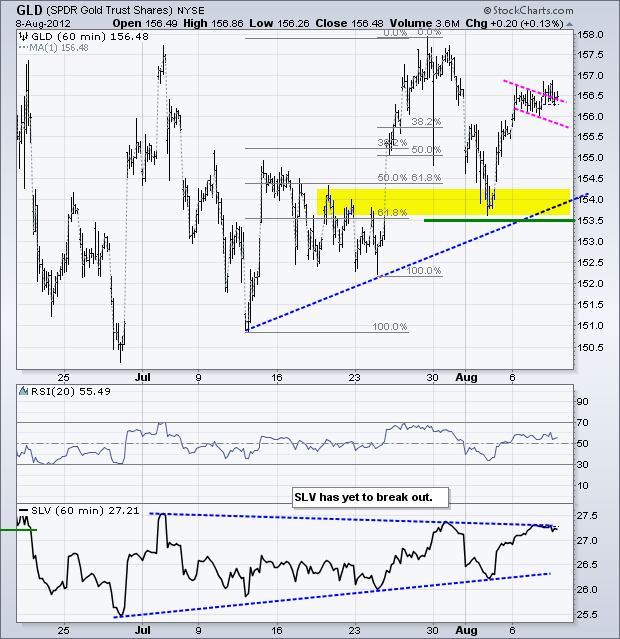
The Gold SPDR (GLD) tried to break falling flag resistance, but got stalled around the breakout. Perhaps strength in the Dollar prevented a clean breakout. Overall, GLD has been zigzagging higher since mid July. Even though the bounce off support in the 153.5-154 area is still holding, GLD has yet to continue higher and break the late July high. Key support remains at 153.50
**************************************************************************
Key Reports and Events:
Thu - Aug 09 - 08:30 - Jobless Claims
Thu - Aug 09 - 10:00 - Wholesale Inventories
Fri – Aug 31 – 09:00 – Jackson Hole Central Bank Symposium
Charts of Interest: Tuesday and Thursday
This commentary and charts-of-interest are designed to stimulate thinking. This analysis is not a recommendation to buy, sell, hold or sell short any security (stock ETF or otherwise). We all need to think for ourselves when it comes to trading our own accounts. First, it is the only way to really learn. Second, we are the only ones responsible for our decisions. Think of these charts as food for further analysis. Before making a trade, it is important to have a plan. Plan the trade and trade the plan. Among other things, this includes setting a trigger level, a target area and a stop-loss level. It is also important to plan for three possible price movements: advance, decline or sideways. Have a plan for all three scenarios BEFORE making the trade. Consider possible holding times. And finally, look at overall market conditions and sector/industry performance.

About the author:
Arthur Hill, CMT, is the Chief Technical Strategist at TrendInvestorPro.com. Focusing predominantly on US equities and ETFs, his systematic approach of identifying trend, finding signals within the trend, and setting key price levels has made him an esteemed market technician. Arthur has written articles for numerous financial publications including Barrons and Stocks & Commodities Magazine. In addition to his Chartered Market Technician (CMT) designation, he holds an MBA from the Cass Business School at City University in London.
Learn More


