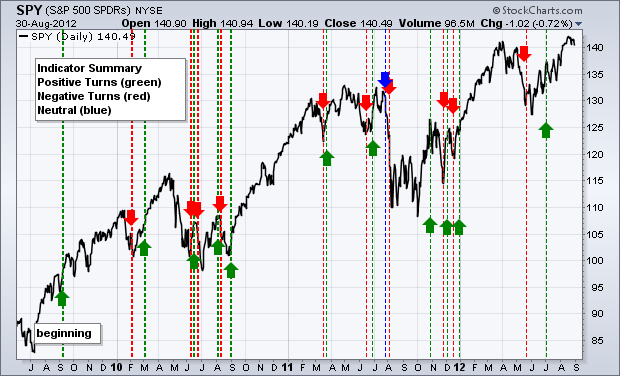
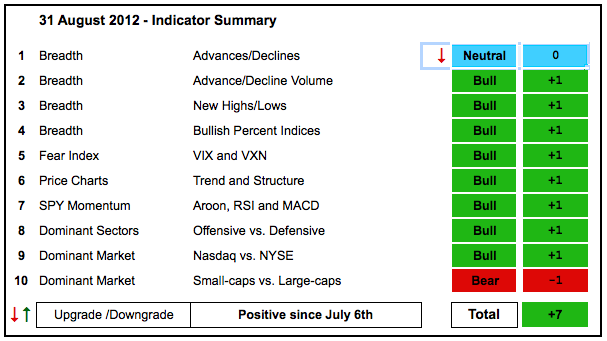
The top pickers are circling the wagons as we roll into September, October, the election, the fiscal cliff, a Euro crisis and a Chinese slow down. Even though this is enough to push one to the sidelines, keep in mind that most of this is probably already priced into the market. In fact, pretty everything we hear or read is already known and priced in to the market. The technical picture continues to favor the bulls, but the correction over the last two weeks has taken its toll. The Nasdaq AD Line stinks, the Nasdaq AD Volume Line formed a bearish divergence and Net New Highs are waning. Despite these negatives, we have yet to see enough selling pressure to change these indicators from bullish to bearish. This indicator summary is not designed to pick tops and bottoms. Instead, it is designed to assess the current state of the stocks market. Despite clear pockets of weakness, the bulk of the evidence still favors the bulls.
- AD Lines: Neutral. The Nasdaq AD Line formed a lower high in August and a triangle the last three months. The NYSE AD Line remains strong with a new high last week and clear uptrend.
- AD Volume Lines: Bullish. The Nasdaq AD Volume Line failed to take out its early July high and formed a bearish divergence. A break below the August low would be outright bearish. The NYSE AD Volume Line did take out its early July high and remains in an uptrend with the late July low marking key support.
- Net New Highs: Bullish. Nasdaq Net New Highs and NYSE Net New Highs remain positive and the cumulative Net New Highs lines are above their 10-day EMAs.
- Bullish Percent Indices: Bullish. All nine sector BPIs are above 50%.
- VIX/VXN: Bullish. The Nasdaq 100 Volatility Index ($VXN) and the CBOE Volatility Index ($VIX) surged the last two weeks as some fear crept into the market. The overall trends remain down though. Perhaps this surge in fear is positive from a contrarian standpoint.
- Trend-Structure: Bullish. DIA, OEF, QQQ and SPY hit new highs in August and then consolidated. IWM and MDY fell short of their spring highs and show relative weakness over the last four months.
- SPY Momentum: Bullish. MACD(5,35,5) and Aroon turned down, but remain well above zero and bullish overall. RSI hit 70 and pulled back.
- Offensive Sector Performance: Bullish. XLK and XLF are actually outperforming on the one and three month timeframes. XLY performance picked up the last few weeks. XLI remains the weakest link for the offensive sectors.
- Nasdaq Performance: Bullish. The $COMPQ:$NYA ratio is back near its April high as the Nasdaq outperforms the NY Composite.
- Small-cap Performance: Bearish. The $RUT:$OEX bounced sharply in August, but remains in a downtrend since February.
- Breadth Charts (here) and Inter-market charts (here) have been updated.

Previous turns include:
Positive on 6-July-12
Negative on 18-May-12
Positive on 30-December-11
Negative on 16-December-11
Positive on 3-December-11
Negative on 23-November-11
Positive on 28-October-11
Negative on 5-August-11
Neutral on 29-Jul-11
Positive on 30-Jun-11
Negative on 17-Jun-11
Positive on 25-Mar-11
Negative on 18-Mar-11
Positive on 3-Sep-10
Negative on 13-Aug-10
Positive on 6-Aug-10
Negative on 24-Jun-10
Positive on 18-Jun-10
Negative on 11-Jun-10
Positive on 5-March-10
Negative on 5-Feb-10
Positive on 11-Sept-09


