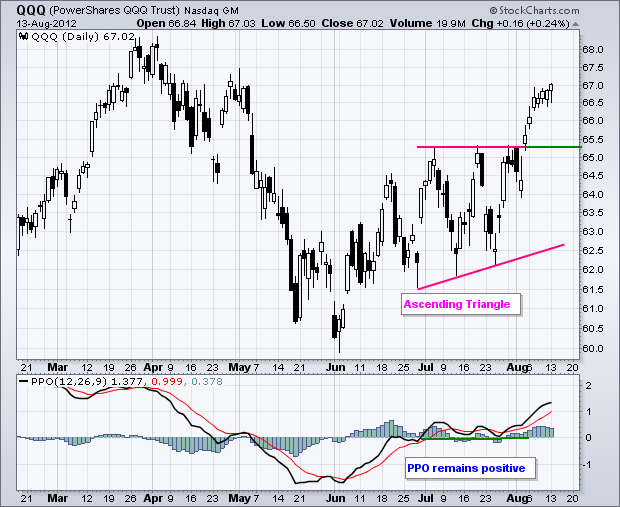
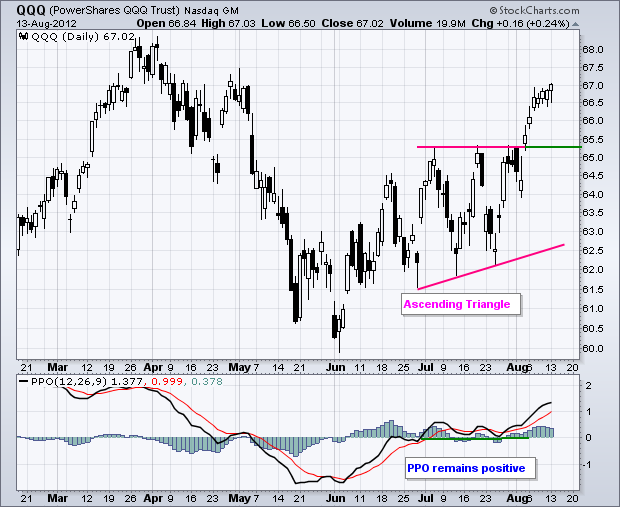
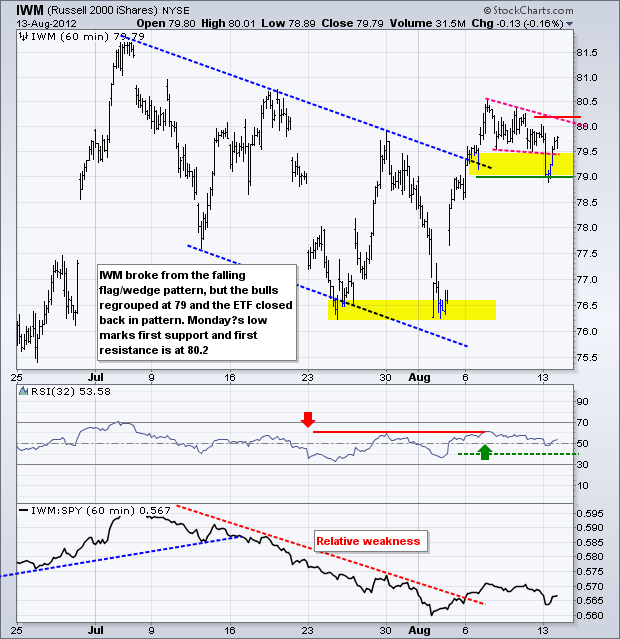
The major index ETFs moved lower in early trading on Monday, but quickly firmed and advanced in afternoon trading. Even though the change from Friday's close to Monday's close was minimal, the ability to recover and close strong is a positive sign. Buying pressure is coming into the market after even the smallest of declines. Overall, the major index ETFs finished mixed with the Nasdaq 100 ETF (QQQ) edging higher and the Russell 2000 ETF (IWM) edging lower.
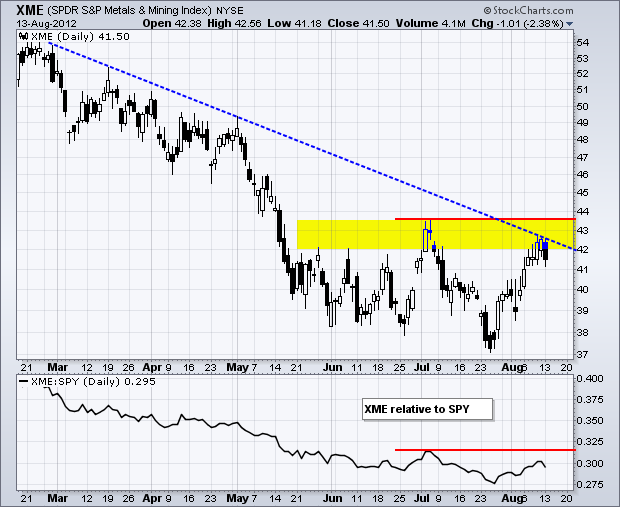
The sectors were little changed. Seven were fractionally lower and two were fractionally higher. Even though the sectors barely moved, several industry groups were hit rather hard. The Technology SPDR (XLK) scored the biggest gain (.30%), but the Market Vectors Semiconductor ETF (SMH) fell .77% and the Networking iShares (IGN) declined .88%. The Basic Materials SPDR (XLB) recorded the smallest loss (-.55%), but this was masked by a 2.38% decline in the Metals & Mining SPDR (XME) and a 2% decline in the Coal Vectors ETF (KOL). The Gold Miners ETF (GDX) was also down on the day.
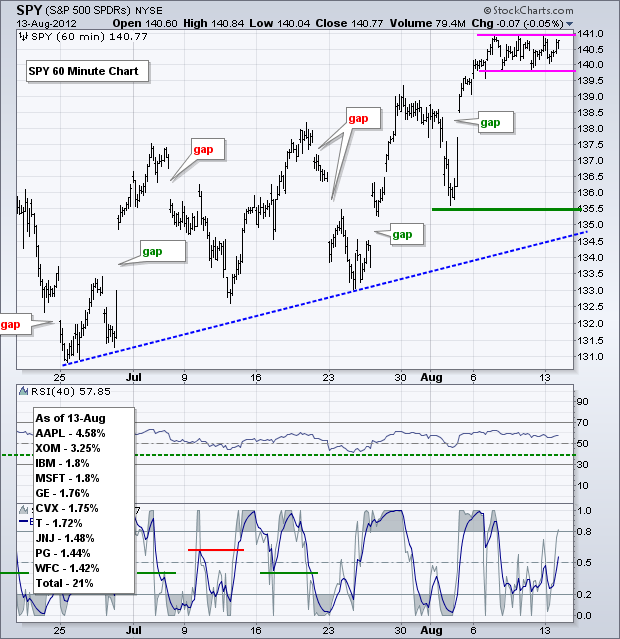
There is no change for the S&P 500 ETF (SPY), which remains in a clear uptrend as it consolidates above its late July high. This flat consolidation looks like a high and tight flag. Technically, a break above 141 would signal a continuation higher. The flag lows mark first support and a break below this level would argue for a pullback or minor correction. Should SPY break support here, I would mark the next support zone in 138.5-139 area. Support here stems from broken resistance and the top of the gap zone. 40-period RSI has been in bull mode since mid June because it remains above 40, which marks uptrend support for momentum.
**************************************************************************
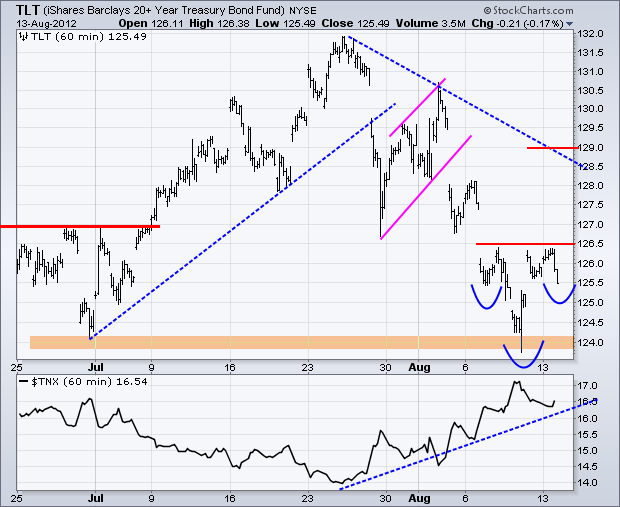
The treasury market will be watching Tuesday morning's retail sales number. Anything below expectations would be positive for treasuries, while anything above expectations would be negative. Stocks will likely move opposite of treasuries. The 20+ Year T-Bond ETF (TLT) is bouncing off support and has a small inverse head-and-shoulders pattern working. A break above 126.5 would argue for further strength towards the 128 area.
**************************************************************************
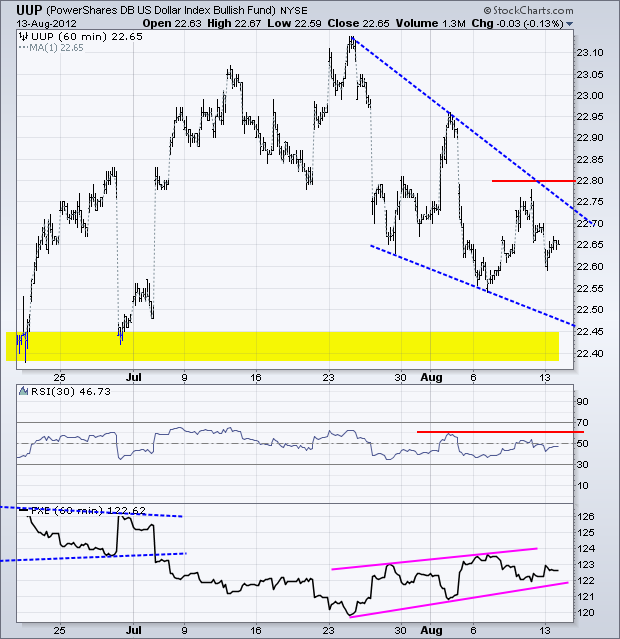
No change. The big trend for the US Dollar Fund (UUP) is up with support on the daily chart set around 22.40 from the June lows. The short-term trend is down as a falling wedge takes shape. UUP bounced within this wedge, but we need to see follow through for a breakout to reverse this downtrend. RSI resistance is set at 60.
**************************************************************************
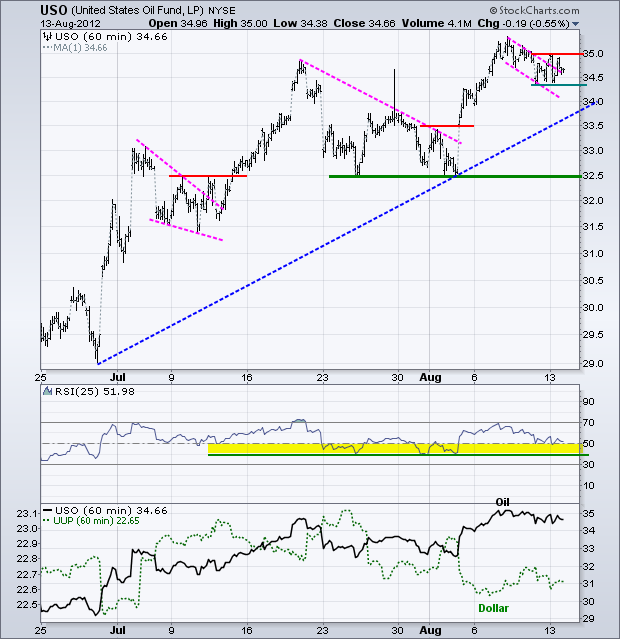
The US Oil Fund (USO) attempted a breakout, but fell back as trading turned choppy in the 34.5-35 area. The falling flag pattern remains and a break above 35 would be bullish. The Friday-Monday lows mark a support level now and a break would argue for a deeper pullback. RSI is trading at its support zone (40-50) and remains in bull mode overall.
**************************************************************************
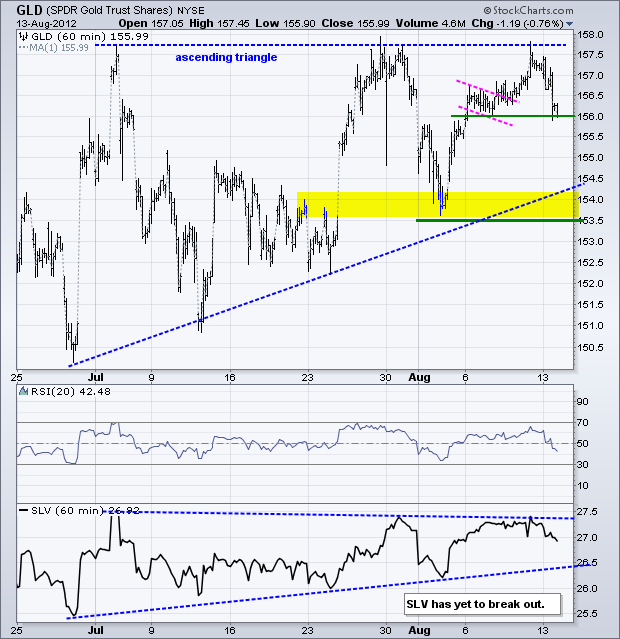
The Dollar moved lower and stocks closed off their lows, but the Gold SPDR (GLD) also moved lower and closed weak. Boo hiss. The ascending triangle remains in play with resistance in the 157.5-158 area. The sharp decline from resistance is a negative though and a break below 156 would open the door to further short-term weakness. In the indicator window, notice that the Silver Trust (SLV) failed at resistance and moved lower.
**************************************************************************
Key Reports and Events:
Tue - Aug 14 - 08:30 - Retail Sales
Tue - Aug 14 - 08:30 - PPI
Tue - Aug 14 - 10:00 - Business Inventories
Wed - Aug 15 - 08:30 - CPI
Wed - Aug 15 - 08:30 - Empire Manufacturing
Wed - Aug 15 - 09:15 - Industrial Production
Wed - Aug 15 - 10:00 - NAHB Housing Market Index
Wed - Aug 15 - 10:30 - Crude Inventories
Thu - Aug 16 - 08:30 - Initial Claims
Thu - Aug 16 - 08:30 - Housing Starts/Building Permits
Thu - Aug 16 - 10:00 - Philadelphia Fed
Fri - Aug 17 - 09:55 - Michigan Sentiment
Fri - Aug 17 - 10:00 - Leading Economic Indicators
Fri – Aug 31 – 09:00 – Jackson Hole Central Bank Symposium
Charts of Interest: Tuesday and Thursday
This commentary and charts-of-interest are designed to stimulate thinking. This analysis is not a recommendation to buy, sell, hold or sell short any security (stock ETF or otherwise). We all need to think for ourselves when it comes to trading our own accounts. First, it is the only way to really learn. Second, we are the only ones responsible for our decisions. Think of these charts as food for further analysis. Before making a trade, it is important to have a plan. Plan the trade and trade the plan. Among other things, this includes setting a trigger level, a target area and a stop-loss level. It is also important to plan for three possible price movements: advance, decline or sideways. Have a plan for all three scenarios BEFORE making the trade. Consider possible holding times. And finally, look at overall market conditions and sector/industry performance.

About the author:
Arthur Hill, CMT, is the Chief Technical Strategist at TrendInvestorPro.com. Focusing predominantly on US equities and ETFs, his systematic approach of identifying trend, finding signals within the trend, and setting key price levels has made him an esteemed market technician. Arthur has written articles for numerous financial publications including Barrons and Stocks & Commodities Magazine. In addition to his Chartered Market Technician (CMT) designation, he holds an MBA from the Cass Business School at City University in London.
Learn More
