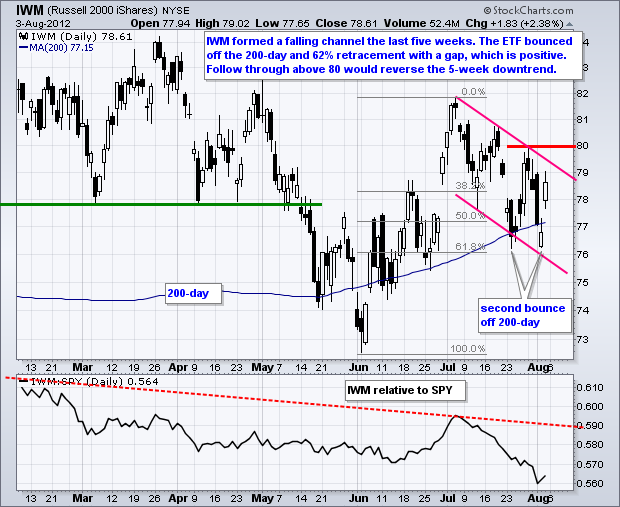
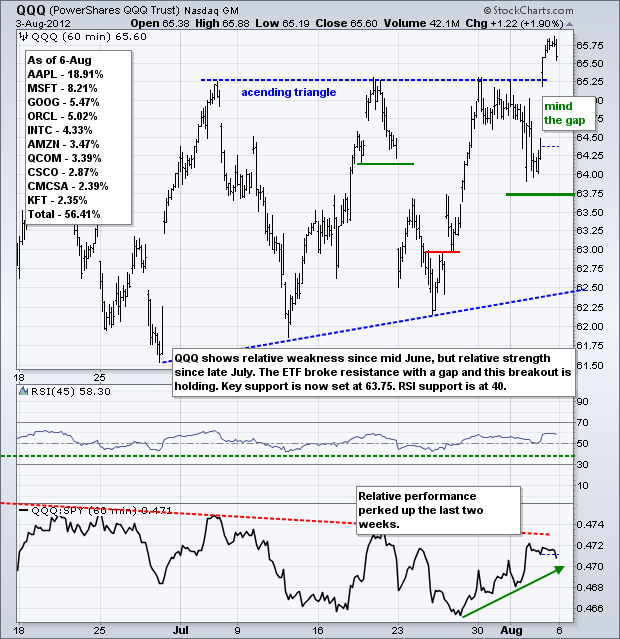
There it is again. Stocks were pushed down early in the week, but positive news on employment and the ISM Services Index produced a very sharp rally on Friday. Small-caps led the surge as the Russell 2000 ETF (IWM) gained over 2%. All sectors were higher with the finance, industrials and energy sectors leading the way. All three gained over 2% on the day. A big surge in stocks triggered the risk-on trade, which means money moved out of the Dollar and treasuries. Oil, the Euro and gold also moved higher. With this big surge, the Nasdaq 100 ETF (QQQ) broke resistance and exceeded its July high. The chart below shows the Russell 2000 ETF (IWM) gapping back above the 200-day moving average and holding support at the 61.80% retracement for the second time in two weeks. The trend since early July, however, is still down with a falling channel taking shape. Look for follow through above channel resistance to trigger a breakout.
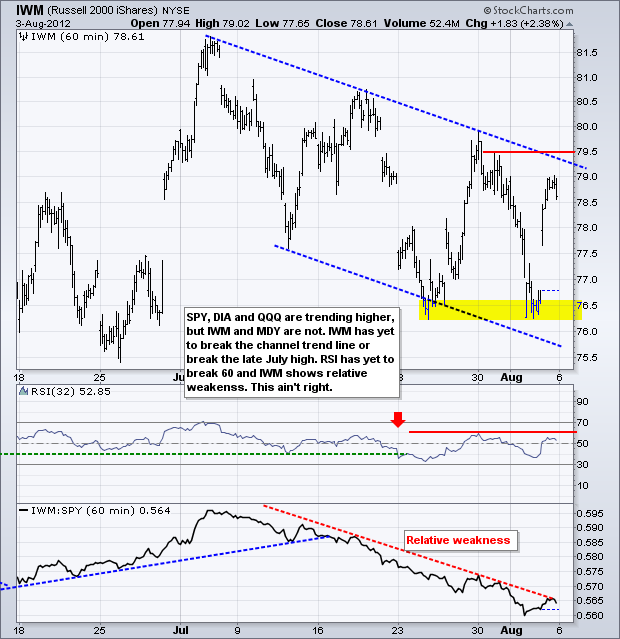
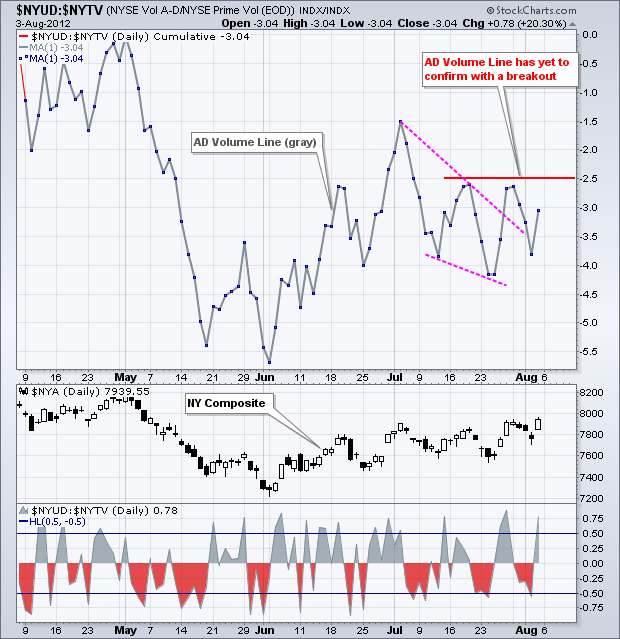
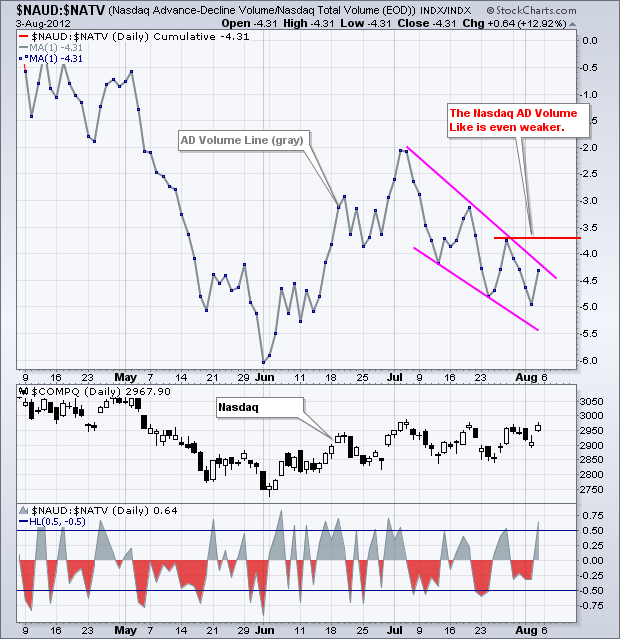
Even though QQQ broke resistance and SPY hit a new high for the move, I remain concerned with relative weakness in small-caps and mid-caps. In addition, I am concerned that the AD Volume Lines are not keeping pace. Maybe I am created my own wall-of-worry, but I think these are legitimate issues that could limit upside until remedied. The chart below shows the NYSE AD Volume Line breaking the wedge trend line, but still below the prior two peaks. A follow through breakout is needed to reverse the downtrend that started in July.
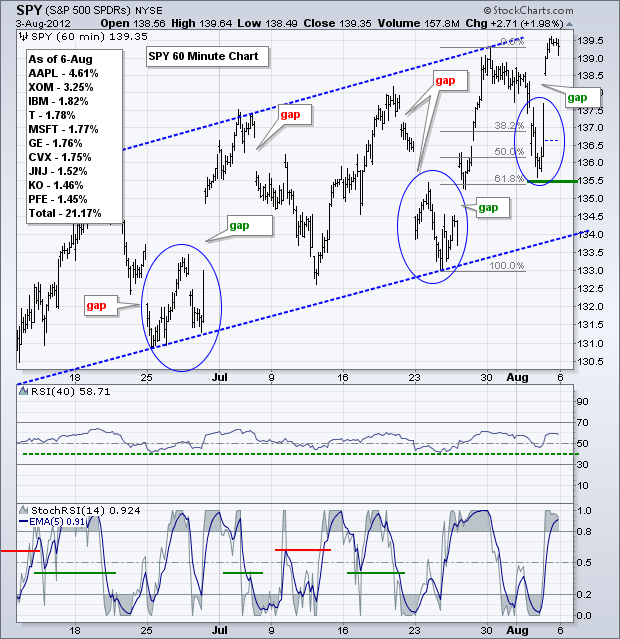
For the third time since mid June, the S&P 500 ETF declined sharply, firmed and then gapped higher. SPY moved to new reaction highs after the three up gaps. Also notice that these three gaps were preceded by down gaps and island reversals formed. Technically, these gaps did not form exact island reversals, but the essence of the island reversal is clearly there. With the gap and close above 139, this week's low becomes key support at 135.50. A strong gap should hold. A move below would completely erase Friday's bounce and argue for a trend reversal. RSI remains in bull mode as it bounced off the 40-50 zone yet again.
**************************************************************************
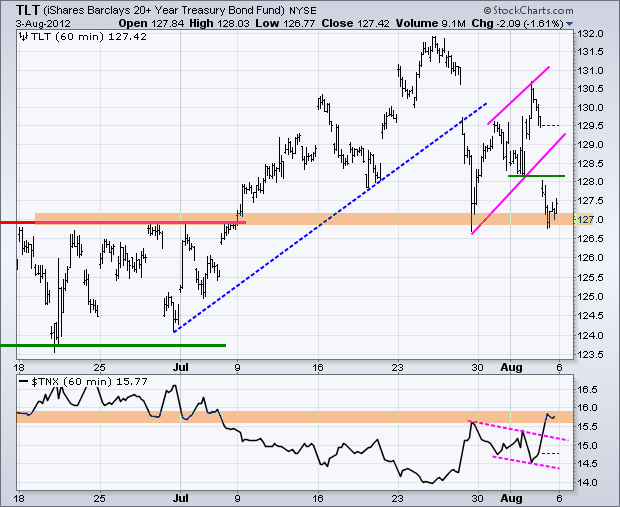
Money moved out of treasuries as the 20+ Year T-Bond ETF (TLT) declined to its late July low. The move broke channel support to reverse the three day advance. Even though the short-term trend for TLT is down, there is still possible support in the 127 area from broken resistance and the late July low. Also notice that the 10-year Treasury Yield ($TNX) is hitting resistance near broken support.
**************************************************************************
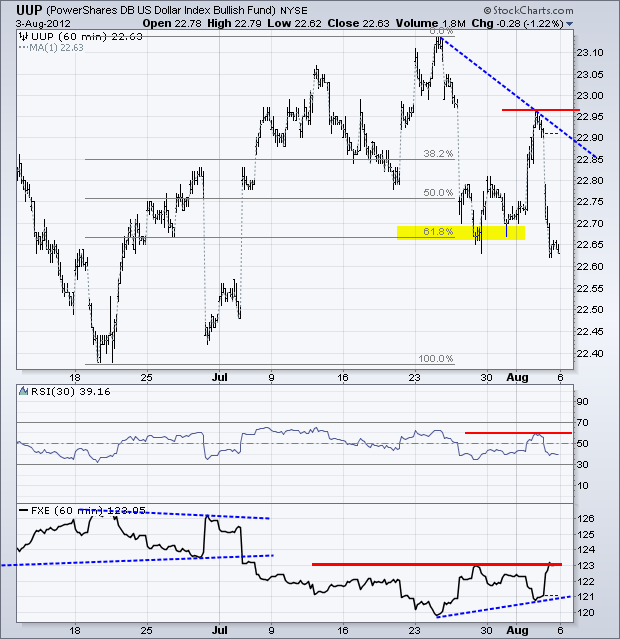
Better-than-expected reports on employment and ISM Services, triggered the risk-on trade and traders sold Dollars to buy Euros. The US Dollar Fund (UUP) broke down with a move below the July low. While I still think the medium-term and long-term trends are up for UUP, the short-term trend is down and very choppy. The early August high marks first resistance. I set RSI at 30 because the indicator held resistance at 60 in early August with this setting. A break above 60 would be bullish for momentum.
**************************************************************************
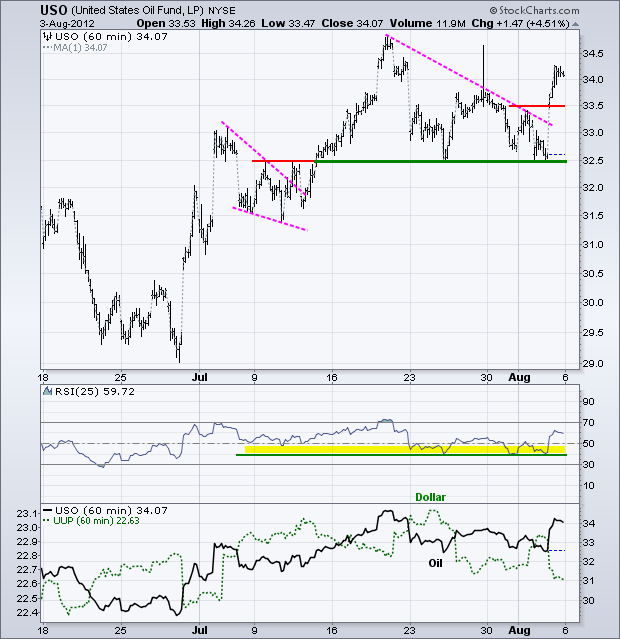
Strength in the stock market and weakness in the Dollar boosted oil as the US Oil Fund (USO) broke above resistance at 33.50. Also notice that USO held support at 32.5 and RSI held support at 40. These two levels hold the key for the short-term uptrend.
**************************************************************************
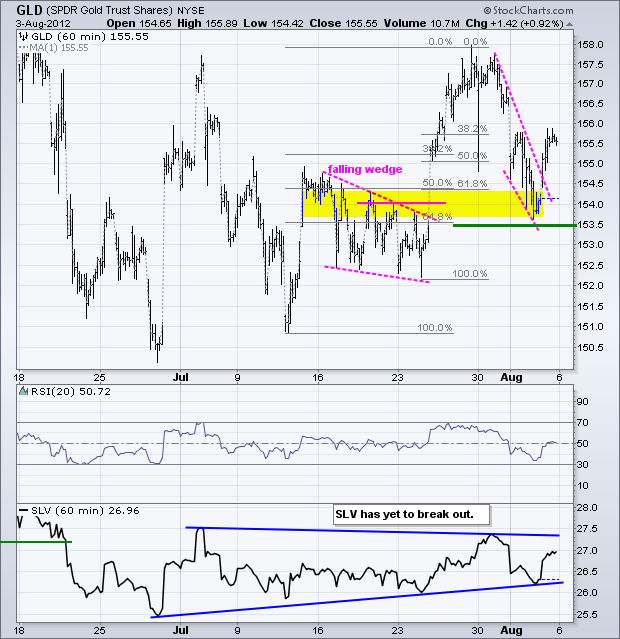
The Gold SPDR (GLD) also moved higher on Friday, but the surge was not that impressive. GLD ultimately held support near broken resistance and broke the falling wedge trend line. This move reinforces support in the 154 area. A break below 153.5 would clearly negate this breakout and put the bears back in control.
**************************************************************************
Key Reports and Events:
Wed - Aug 08 - 07:00 - MBA Mortgage Index
Wed - Aug 08 - 10:30 - Oil Inventories
Thu - Aug 09 - 08:30 - Jobless Claims
Thu - Aug 09 - 10:00 - Wholesale Inventories
Fri – Aug 31 – 09:00 – Jackson Hole Central Bank Symposium
Charts of Interest: Tuesday and Thursday
This commentary and charts-of-interest are designed to stimulate thinking. This analysis is not a recommendation to buy, sell, hold or sell short any security (stock ETF or otherwise). We all need to think for ourselves when it comes to trading our own accounts. First, it is the only way to really learn. Second, we are the only ones responsible for our decisions. Think of these charts as food for further analysis. Before making a trade, it is important to have a plan. Plan the trade and trade the plan. Among other things, this includes setting a trigger level, a target area and a stop-loss level. It is also important to plan for three possible price movements: advance, decline or sideways. Have a plan for all three scenarios BEFORE making the trade. Consider possible holding times. And finally, look at overall market conditions and sector/industry performance.

