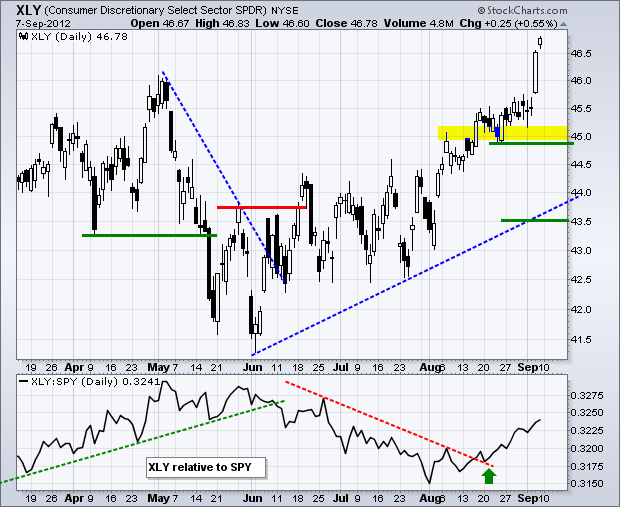
Stocks extended their gains on Friday and the S&P 500 finished with its biggest weekly gain since early July. This key benchmark index cleared its spring highs and closed at a 52-week high on Friday. Five of the nine sector SPDRs were up on Friday. The technology sector ended slightly lower and money moved out of the defensive sectors (consumer staples, healthcare and utilities). Energy and materials led on Friday as money moved into areas of the market that would benefit from more quantitative easing (commodities). The Consumer Discretionary SPDR (XLY) surged to a 52-week high and continues to show upside leadership. The ETF is, however, a little overbought after a big run the last five weeks and retail sales will be reported on Friday. In fact, the back half of the week is loaded with reports and breaking news. The Fed starts its two-day meeting on Wednesday, Apple makes a product announcement and the German constitutional court will rule.

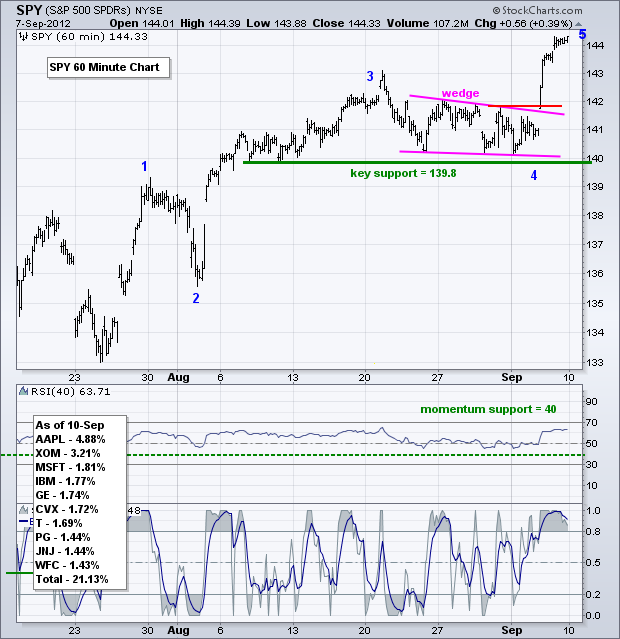
After a long consolidation, the S&P 500 ETF (SPY) broke free with a big move above 142 late last week. The breakout is clearly bullish and clearly holding. Broken resistance turns into first support in the 142 area. A move back below 141.8 would negate the breakout and call for a reassessment. Such a move would not reverse the uptrend though. The lows extending from early August mark a clear support zone around 140. It would take a break below 139.8 would fully reverse the short-term uptrend. RSI support is set at 40.
**************************************************************************
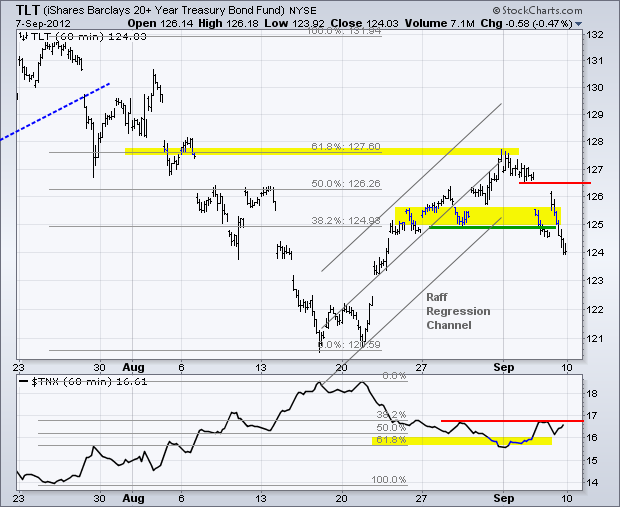
Treasuries will remain on the hot seat again this week as the Fed meets on Wednesday and makes its policy statement on Thursday. Will this be the big QE announcement or will the Fed keep the markets guessing? The 20+ Year T-Bond ETF (TLT) broke down on Thursday with a move below 125. TLT surged early Friday, but quickly gave up its gains and fall to 124 by the close. The short-term trend reversal remains with first resistance marked at 126.50.
**************************************************************************
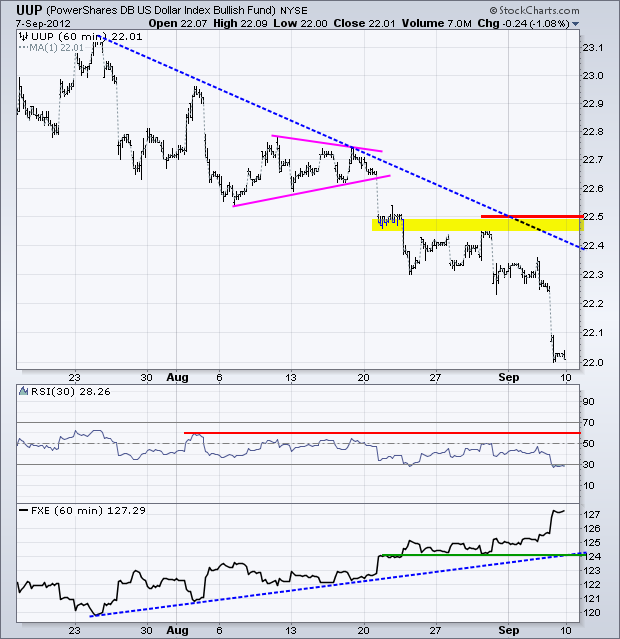
The Dollar got squashed again on Friday as the US Dollar Fund (UUP) plunged below 22.10 and stayed down. The short-term downtrend extended and there is not much change on the chart, other than some severe oversold conditions. The late August consolidation marks the first resistance zone around 22.3-22.50. RSI resistance is set in the 50-60 zone.
**************************************************************************
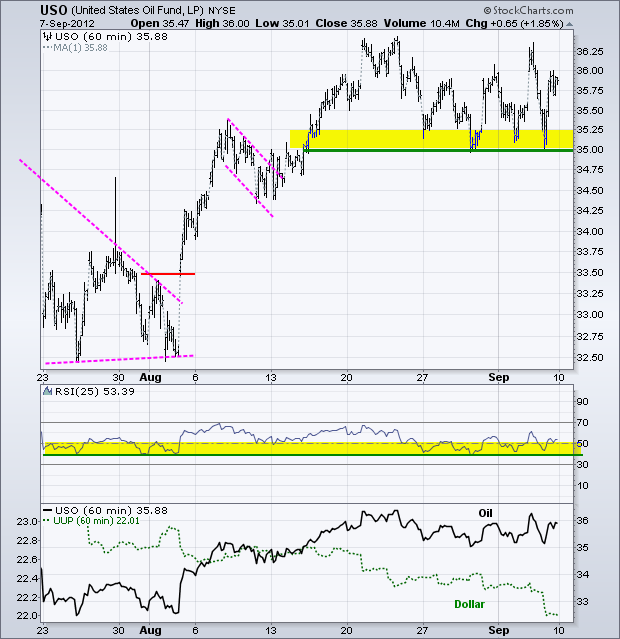
Oil is all mixed up with no place to go. Even though the Dollar fell sharply and stocks surged, the US Oil Fund (USO) is still bouncing around support in the 35 area. USO should be much higher considering the help it has had from the greenback and stock market. Despite dragging its feet, USO is holding support at 35 and RSI is holding support at 40. A break in both would be short-term bearish.
**************************************************************************
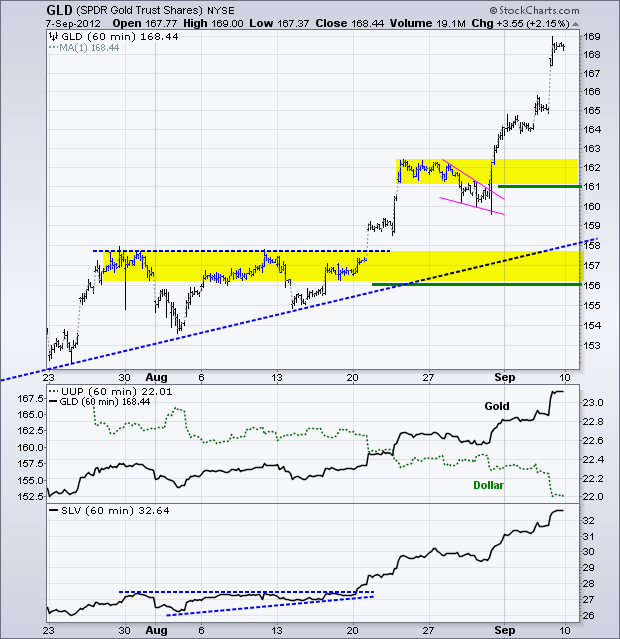
Gold is certainly taking advantage of a weak Dollar and the prospects of more quantitative easing. The Gold SPDR (GLD) broke out in mid August, continued higher in late August and surged above 168 at the end of last week. GLD is as overbought as the Dollar is oversold, but shows no signs of weakness. First support is set in the 161-162 area. Key support remains in the 156-158 area.
**************************************************************************
Key Reports and Events:
Tue – Sep 11 – 09:00 – Troika to Greece
Wed - Sep 12 - 07:00 - MBA Mortgage Index
Wed – Sep 12 – 09:00 – German Ruling on European Stability Mechanism (ESM)
Wed – Sep 12 – 09:00 – EU Commission Banking Union Proposal
Wed – Sep 12 – 09:00 – Dutch Elections
Wed - Sep 12 - 10:30 - Oil Inventories
Wed – Sep 12 – 14:15 – FOMC meeting begins
Wed – Sep 12 – 09:00 – Apple Event for iPhone 5, iPad mini, iCar, iWife....
Thu - Sep 13 - 08:30 - Jobless Claims
Thu - Sep 13 - 08:30 – Producer Price Index (PPI)
Thu - Sep 13 - 12:30 – FOMC Policy Statement
Fri - Sep 14 - 08:30 - Retail Sales
Fri - Sep 14 - 08:30 – Consumer Price Index (CPI)
Fri - Sep 14 - 09:15 - Industrial Production
Fri - Sep 14 - 09:55 - Michigan Sentiment
Sat – Oct 06 – 09:00 – EU Summit
Charts of Interest: Tuesday and Thursday
This commentary and charts-of-interest are designed to stimulate thinking. This analysis is not a recommendation to buy, sell, hold or sell short any security (stock ETF or otherwise). We all need to think for ourselves when it comes to trading our own accounts. First, it is the only way to really learn. Second, we are the only ones responsible for our decisions. Think of these charts as food for further analysis. Before making a trade, it is important to have a plan. Plan the trade and trade the plan. Among other things, this includes setting a trigger level, a target area and a stop-loss level. It is also important to plan for three possible price movements: advance, decline or sideways. Have a plan for all three scenarios BEFORE making the trade. Consider possible holding times. And finally, look at overall market conditions and sector/industry performance.

About the author:
Arthur Hill, CMT, is the Chief Technical Strategist at TrendInvestorPro.com. Focusing predominantly on US equities and ETFs, his systematic approach of identifying trend, finding signals within the trend, and setting key price levels has made him an esteemed market technician. Arthur has written articles for numerous financial publications including Barrons and Stocks & Commodities Magazine. In addition to his Chartered Market Technician (CMT) designation, he holds an MBA from the Cass Business School at City University in London.
Learn More


