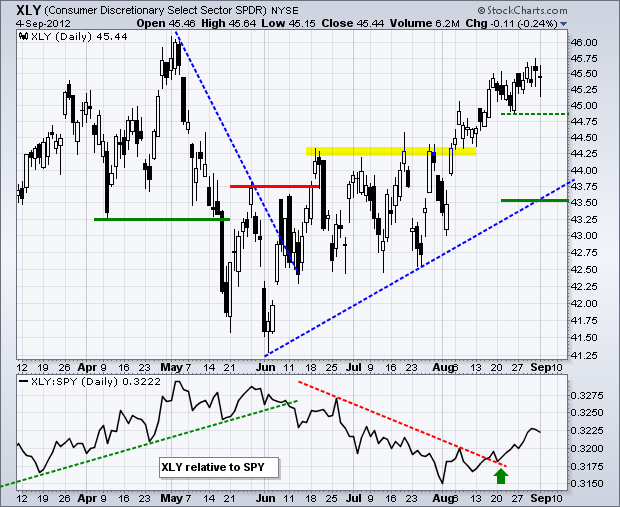
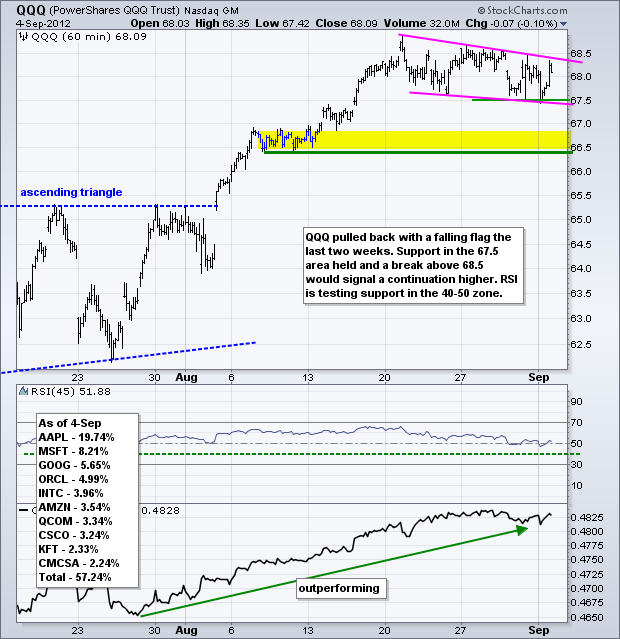
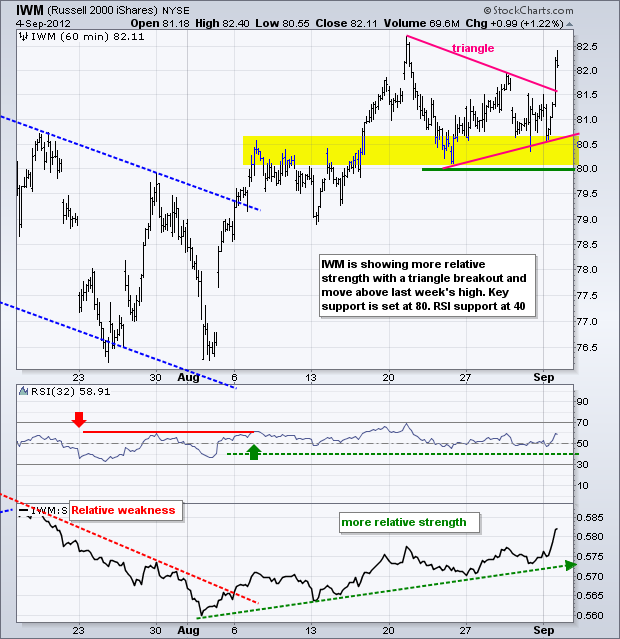
Economic reports triggered some early selling pressure, but stocks managed to rebound with small-caps leading the charge. The ISM Manufacturing Index showed weakness as the key indicator dipped below 50 (49.6). Anything below 50 indicates a contraction in the manufacturing sector. This was further exasperated by weakness in construction spending, which unexpectedly fell .9%. Stocks took this news to heart and sold off in the morning. Quantitative easing is the upside to these weak economic numbers and stocks surged in the afternoon as visions of QE buoyed the bulls. Small-caps led the way higher as the Russell 2000 ETF (IWM) gained over 1%. The Dow Industrials SPDR (DIA) and S&P 500 ETF (SPY), however, lagged with fractional losses on the day. It is quite positive to see small-caps lead the rebound because they are the most sensitive to changes in the economy. Nevertheless, it was a rather strange session because the offensive sectors lagged and the defensive sectors led. The healthcare, utilities and consumer staples sectors gained, but technology and consumer discretionary sectors lost ground. As the chart below shows, the cup is still half full for the Consumer Discretionary SPDR (XLY) because the ETF is holding support from the mid August low. A break below this level would reverse the short-term uptrend. Medium-term support remains at 43.50.
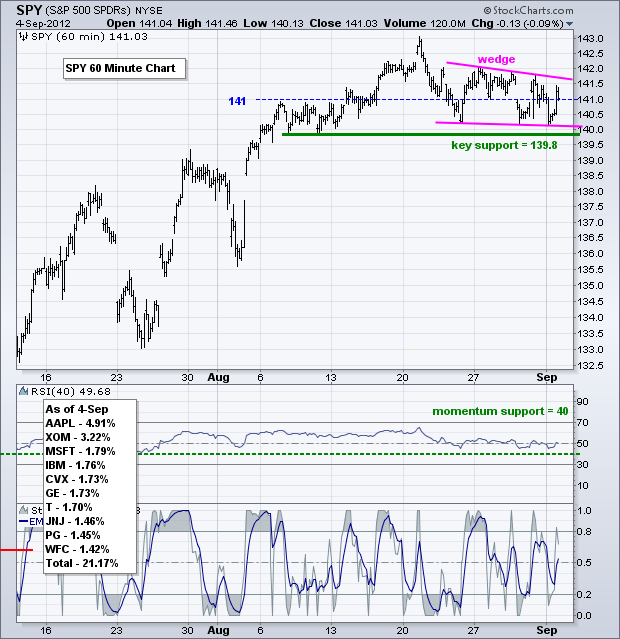
On the 60-minute chart, the S&P 500 ETF (SPY) has been locked in a trading range since the second week of August. Notice how the ETF hit resistance at 141 the second week and then moved above/below this level the last three weeks. Tuesday was no exception as the ETF plunged below 141 on the open and then surged above 141 in the afternoon. Overall, SPY remains stuck in a trading range with support at 140 and resistance at 142. I am setting key support at 140.80, a break of which would be short-term bearish. RSI continues to hover in its support zone (40-50). A break below 40 would be short-term bearish for momentum.
**************************************************************************
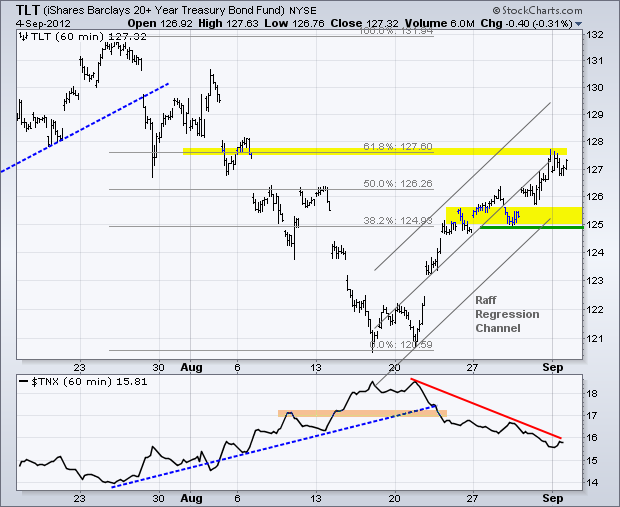
Treasuries seem to favor more quantitative easing from the Fed as the 20+ Year T-Bond ETF (TLT) surged above 127 on Friday and held its gain on Tuesday. Looks like the treasury market expects the Fed to extend its purchase program. Something has to give because stocks and treasuries are negatively correlated. Further strength in treasuries would be negative for stocks. TLT is at the 61.80% retracement line and I am marking key support at last week's low.
**************************************************************************
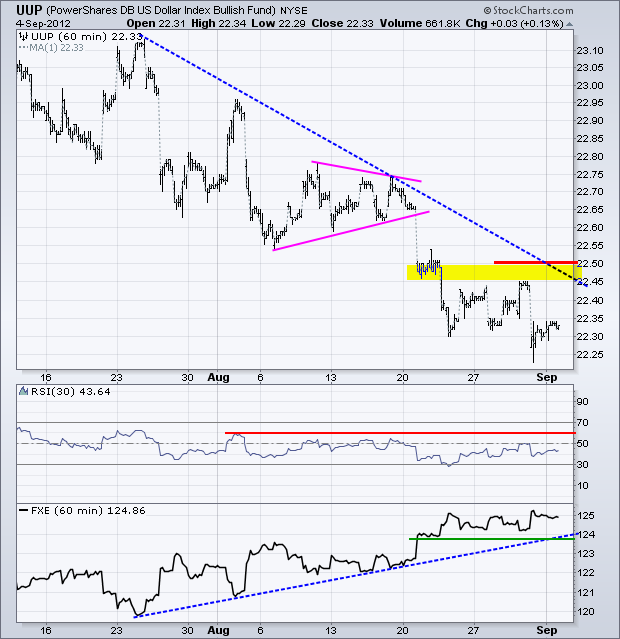
The spotlight could turn to the Euro this week as the European Central Bank (ECB) meets on Thursday. The Fed is not the only central bank ready for quantitative easing. ECB President Drahgi is paving the way to purchase sovereign debt and expand the ECB balance sheet. Sound familiar? In any case, the UUP remains in a six week downtrend and FXE remains in a six week uptrend. UUP is near medium-term support at 81. I am marking key resistance at 22.50 for UUP and key support at 123.8 for FXE. Watch these levels for a possible short-term reversal.
**************************************************************************
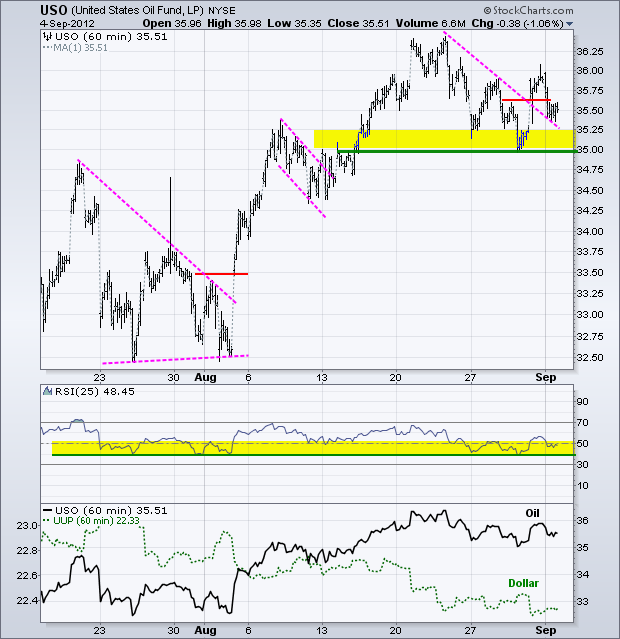
The US Oil Fund (USO) got its breakout, but failed to hold the breakout and moved back to the 35.50 area on Tuesday. RSI fell back into its support zone (40-50). A break below 35 in USO and 40 in RSI would be short-term bearish. A lot depends on the Dollar and stock market. USO is positively correlated with stocks and quantitative easing, but negatively correlated with the Dollar.
**************************************************************************
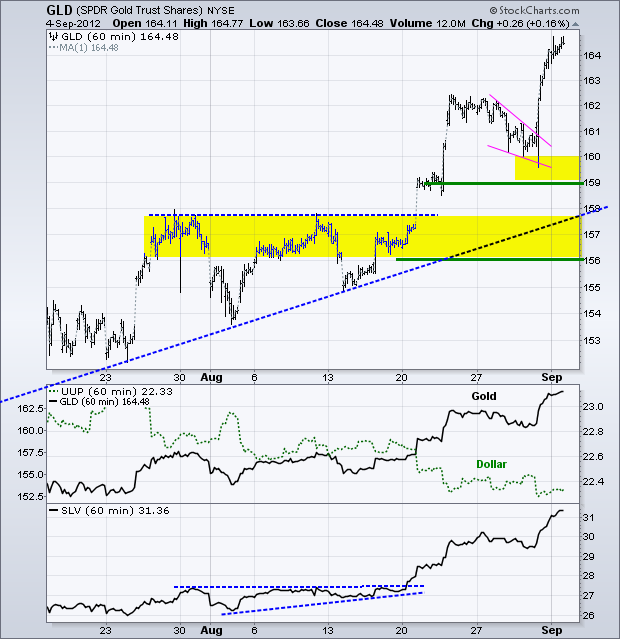
The Gold SPDR (GLD) broke out in mid August, corrected last week and surged again on Friday. GLD continued higher on Tuesday. Last week's correction low marks first support. Broken resistance and the July trend line mark a support zone around 156-158. Keep an eye on the Dollar for clues on gold.
**************************************************************************
Key Reports and Events:
Tue - Sep 04 - 10:00 - ISM Manufacturing Index
Tue - Sep 04 - 10:00 - Construction Spending
Tue - Sep 04 - 14:00 – Auto/Truck Sales
Wed - Sep 05 - 07:00 - MBA Mortgage Index
Thu - Sep 06 - 07:30 - Challenger Job Cuts
Thu - Sep 06 - 08:15 - ADP Employment Change
Thu - Sep 06 - 08:30 - Jobless Claims
Thu – Sep 06 – 09:30 – European Central Bank (ECB) Meeting
Thu - Sep 06 - 10:00 - ISM Services Index
Thu - Sep 06 - 11:00 - Oil Inventories
Fri - Sep 07 - 08:30 – Employment Report
Tue – Sep 11 – 09:00 – Troika to Greece
Wed – Sep 12 – 09:00 – German Ruling on European Stability Mechanism (ESM)
Wed – Sep 12 – 09:00 – EU Commission Banking Union Proposal
Wed – Sep 12 – 09:00 – Dutch Elections
Wed – Sep 12 – 14:15 – FOMC Policy Statement
Wed – Sep 12 – 09:00 – Apple Event for iPhone 5, iPad mini, iCar, iBike....
Sat – Oct 06 – 09:00 – EU Summit
Charts of Interest: Tuesday and Thursday
This commentary and charts-of-interest are designed to stimulate thinking. This analysis is not a recommendation to buy, sell, hold or sell short any security (stock ETF or otherwise). We all need to think for ourselves when it comes to trading our own accounts. First, it is the only way to really learn. Second, we are the only ones responsible for our decisions. Think of these charts as food for further analysis. Before making a trade, it is important to have a plan. Plan the trade and trade the plan. Among other things, this includes setting a trigger level, a target area and a stop-loss level. It is also important to plan for three possible price movements: advance, decline or sideways. Have a plan for all three scenarios BEFORE making the trade. Consider possible holding times. And finally, look at overall market conditions and sector/industry performance.

