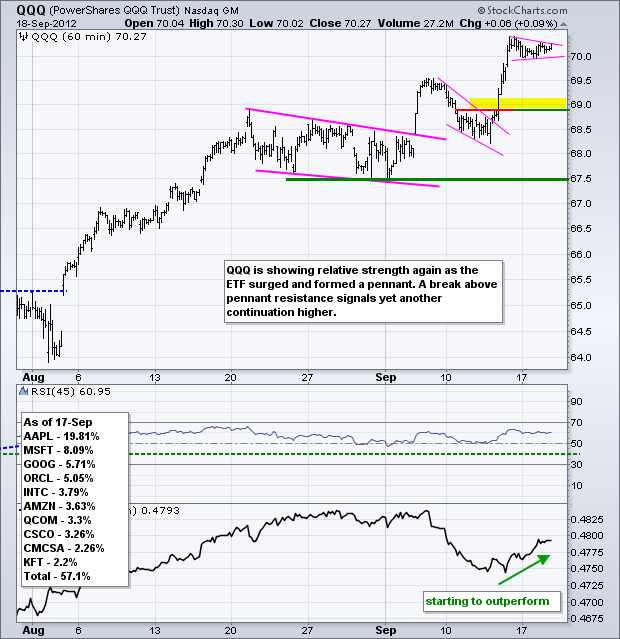
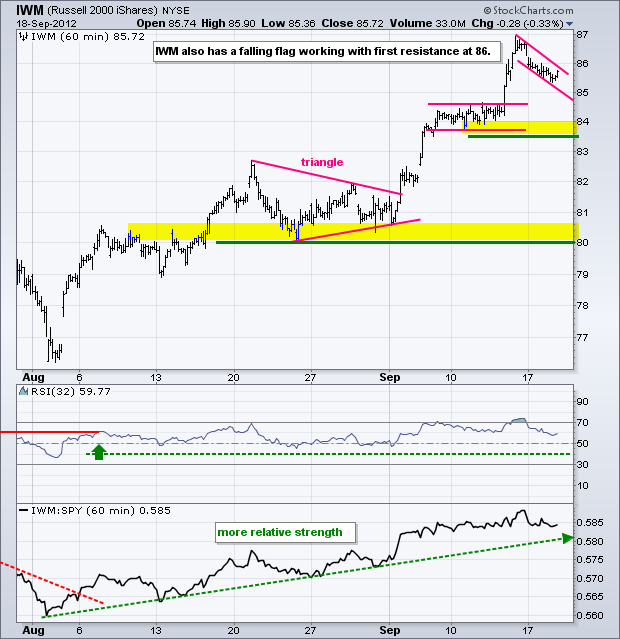
The stock index ETFs continued to drift on Tuesday. After the surge from Thursday afternoon to Friday morning, stocks have been drifting for almost three days. Such a drift is not uncommon after a big move. These consolidations give the market time to digest its gains and provide the bulls with a needed rest. A break above consolidation resistance levels would signal a continuation of the uptrend. Even though the path of least resistance is clearly up, I am concerned that third quarter earnings could weigh on this overbought market over the next six weeks. At the very least, we could see an extended period of choppy trading. These thoughts, however, are just that, thoughts. Thinking can be dangerous when it comes to the market. Most of the time I have found it best to simply abide by the charts and take the signals as they come.
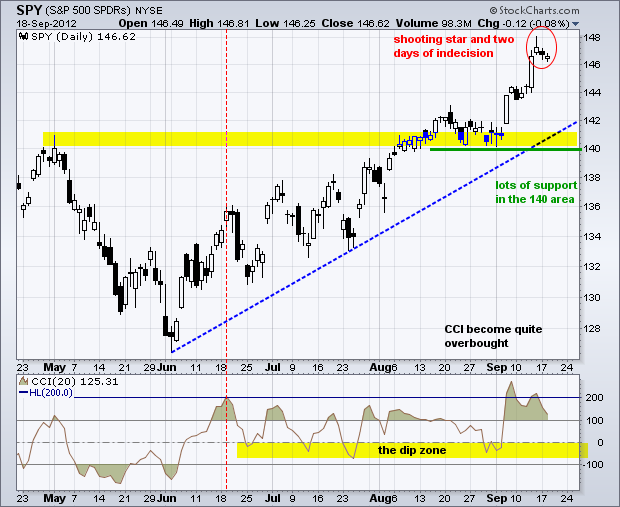
The chart above shows SPY with the Commodity Channel Index (CCI). SPY formed a shooting star candlestick on Friday and then consolidated with two very small candlesticks. The gains are largely holding as the bulls refuse to give much ground. The indicator window shows CCI moving above 200 for the third time this year (March, June, September). Even though overbought is interesting, the trend following signals come when CCI moves into the "dip zone". This yellow area suggests that traders should prepare for a bounce when CCI moves into negative territory.
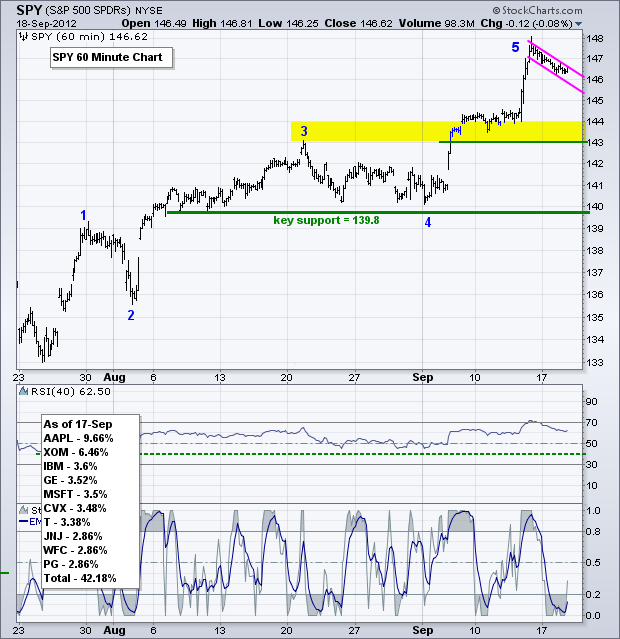
While this may look like the fifth of the fifth in Elliott terms, it also looks like an uptrend using basic technical analysis. After a big surge, SPY formed a falling flag and a break above 147 would signal yet another continuation higher. The chart is littered with pullbacks and consolidations since early June. Moreover, these ended with breakouts and moves to new highs. One will ultimately fail, but picking which one will fail is a guessing game when the bigger trend is clearly up.
**************************************************************************
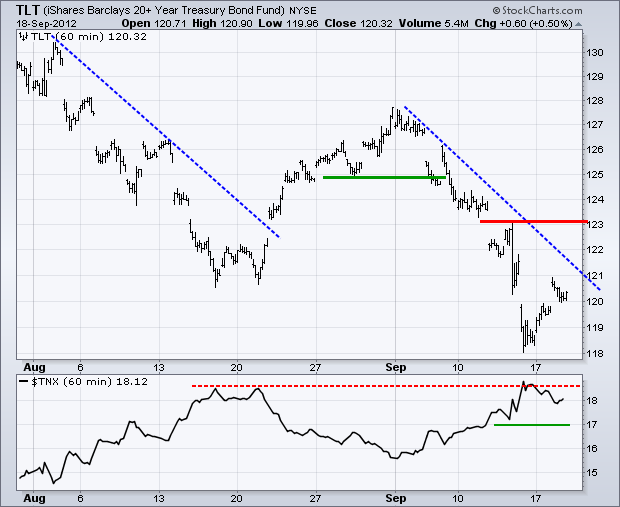
The 20+ Year T-Bond ETF (TLT) became oversold last week and bounced this week. The bounce, however, looks like an oversold bounce within a bigger downtrend. Trend line resistance comes into play in the 121-121.5 area. Key resistance remains at 123.10. The 10-year Treasury Yield ($TNX) is battling resistance from the August highs. Another break above this level would be bullish for yields and bearish for treasuries.
**************************************************************************
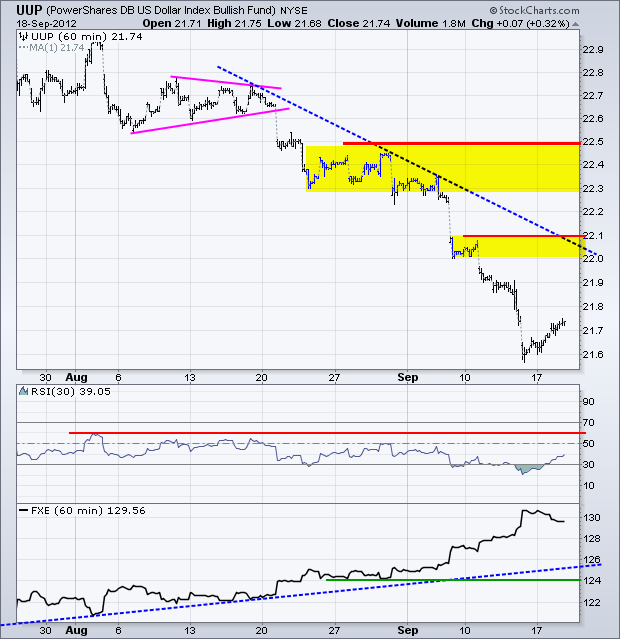
The Dollar also became oversold last week and got an oversold bounce this week. The bounce is feeble to start and remains just an oversold bounce within a bigger downtrend. First resistance is set in the 22-22.10 area. Key resistance remains at 22.5 and RSI resistance at 60.
**************************************************************************
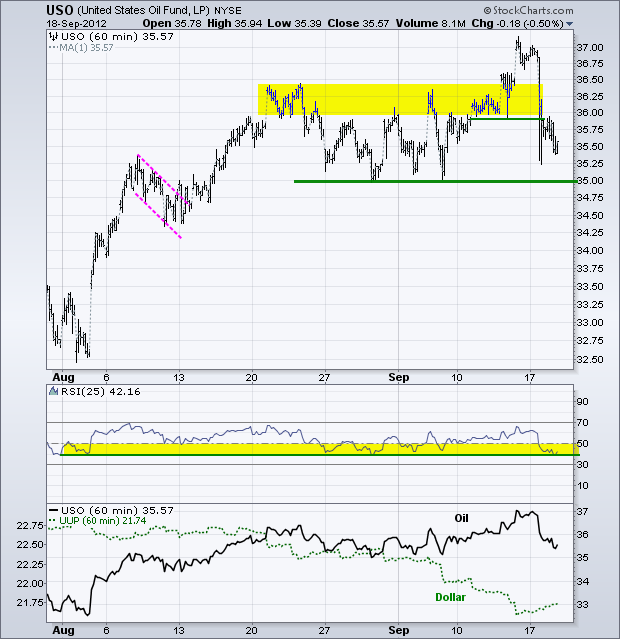
No change. The US Oil Fund (USO) got slammed on Monday afternoon and moved below broken resistance. Oil underperformed during the September advance and the inability to hold the breakout is negative. The trend, however, has yet to reverse because support at 35 is still holding. Watch stocks and the Dollar for clues. A pullback in stocks and bounce in the Dollar would weigh on oil and other commodities, especially overbought gold.
**************************************************************************
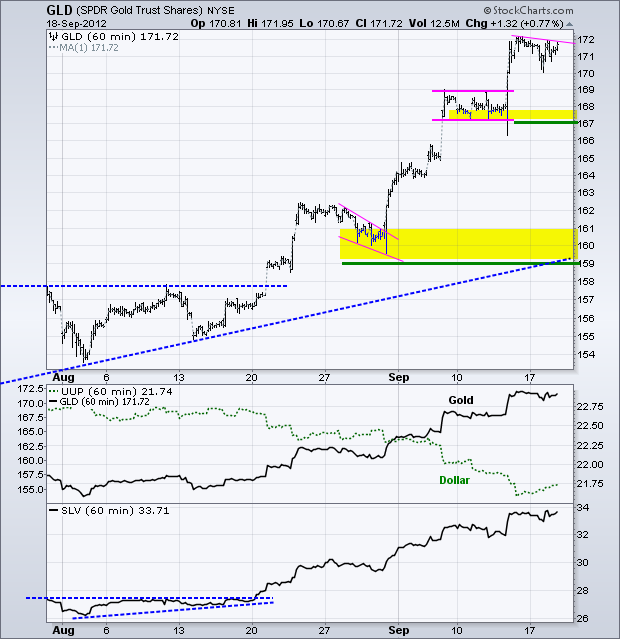
The Gold SPDR (GLD) surged above 171 and then consolidated for a few days. As with late August and early September, this is a consolidation within an uptrend. This means a break above 172 would signal yet another continuation higher. Gold is as overbought as the Dollar is oversold, but we have seen securities become overbought and remain overbought. First support is set at 167 and key support remains at 159 for now.
**************************************************************************
Key Reports and Events:
Wed - Sep 19 - 07:00 - MBA Mortgage Index
Wed - Sep 19 - 08:30 - Housing Starts/Building Permits
Wed - Sep 19 - 10:00 - Existing Home Sales
Wed - Sep 19 - 10:30 - Oil Inventories
Wed - Sep 19 – 16:15 – ADBE Earnings
Thu - Sep 20 - 08:30 - Jobless Claims
Thu - Sep 20 - 10:00 - Philadelphia Fed
Thu - Sep 20 - 10:00 - Leading Indicators
Thu - Sep 20 - 16:15 – Oracle Earnings
Fri - Sep 21 – 08:30 – Darden Restaurants and KB Home Earnings
Sat – Oct 06 – 09:00 – EU Summit
Charts of Interest: Tuesday and Thursday
This commentary and charts-of-interest are designed to stimulate thinking. This analysis is not a recommendation to buy, sell, hold or sell short any security (stock ETF or otherwise). We all need to think for ourselves when it comes to trading our own accounts. First, it is the only way to really learn. Second, we are the only ones responsible for our decisions. Think of these charts as food for further analysis. Before making a trade, it is important to have a plan. Plan the trade and trade the plan. Among other things, this includes setting a trigger level, a target area and a stop-loss level. It is also important to plan for three possible price movements: advance, decline or sideways. Have a plan for all three scenarios BEFORE making the trade. Consider possible holding times. And finally, look at overall market conditions and sector/industry performance.


