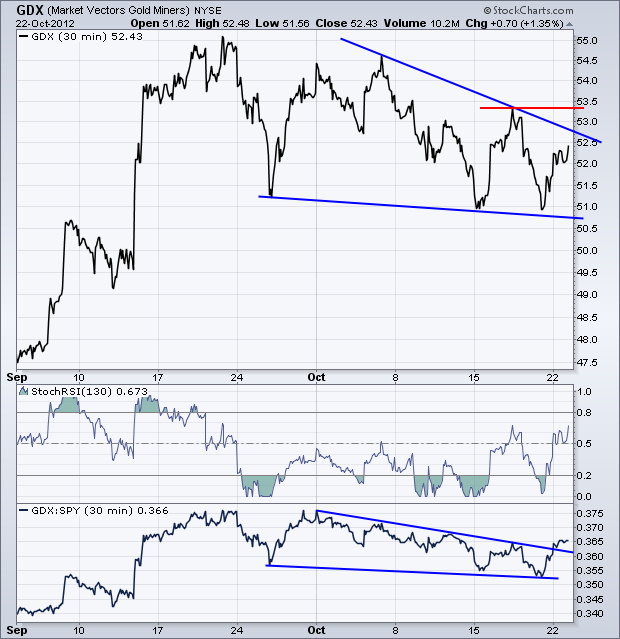
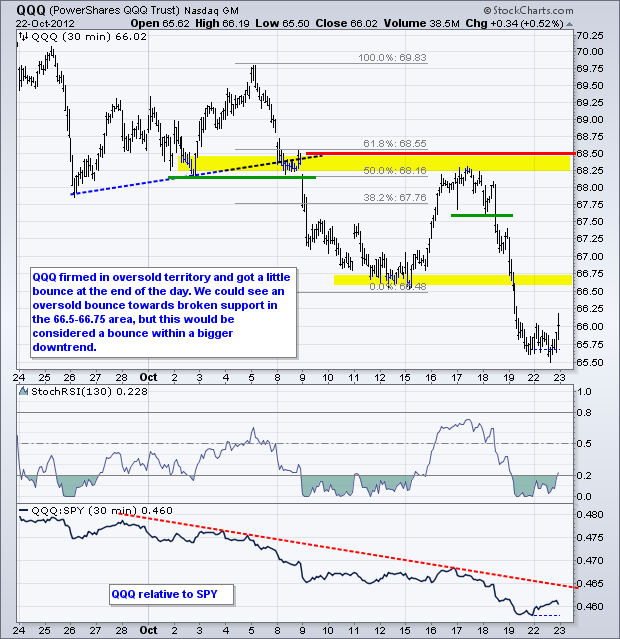
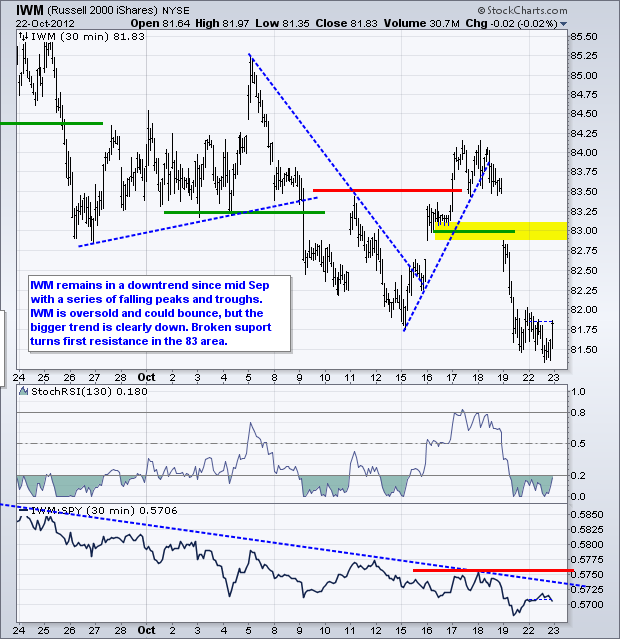
Stocks meandered around on Monday as trading turned quite mixed. The Nasdaq 100 ETF (QQQ) edged higher, while the S&P MidCap 400 SPDR (MDY) edged lower. Apple caught a bid ahead of its earnings report on Thursday. The sectors were also mixed with the Basic Materials SPDR (XLB) gaining .46% and the Energy SPDR (XLE) losing .50% on the day. Strength in steel, coal and gold miners lifted the materials sector. The Gold Miners ETF (GDX) surged in August-September and then consolidated with a falling wedge the last four weeks. A break above last week's high would reverse this short-term downtrend.

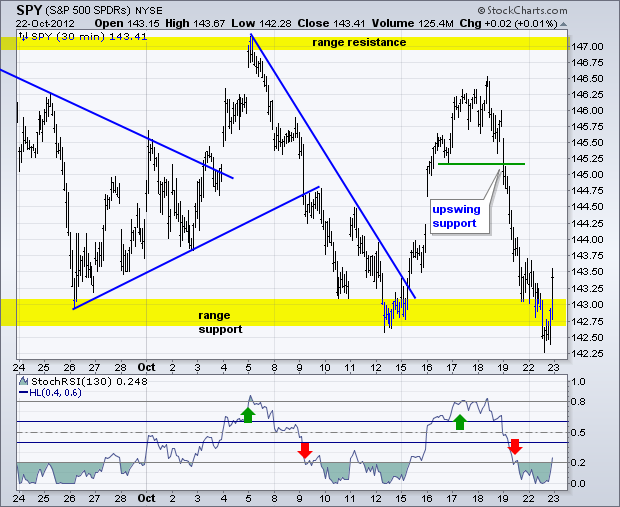
SPY broke below its mid October low, but recovered in the final hour with a surge above 143. The six week trend remains very choppy with a slight downward slant. The swing within this six week trend is down after last week's support break. Marking downswing resistance is a challenge here. I could set resistance at 143.75, but this does not allow much of a buffer for a short oversold bounce. SPY was oversold when below 142.50 and some sort of oversold bounce or consolidation would be normal. I will set resistance at 145.25 for now and lower it later.
**************************************************************************
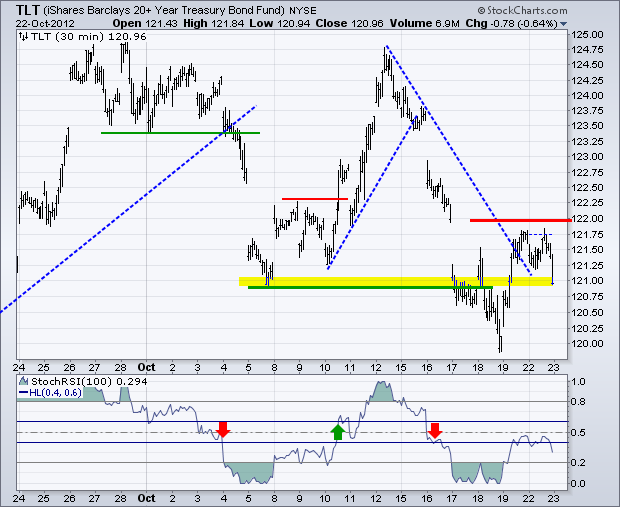
The 20+ Year T-Bond ETF (TLT) got an oversold bounce on Friday and hit resistance just below 122 on Monday. Treasuries lost some of their luster as stocks and the Euro firmed on Monday. The failure at 122 reinforces this level as key short-term resistance. A break above 122 and StochRSI break above .60 would reverse the short-term downtrend.
**************************************************************************
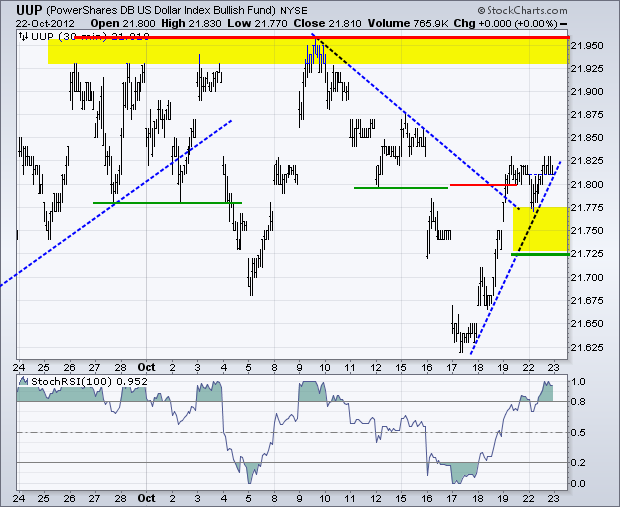
The US Dollar Fund (UUP) surged last week and then stalled in the 21.80 area. The short-term swing is up, but the bigger trend is down with key resistance at the October highs. The one-week trend line and Monday's low mark first support. I am going to add a little buffer and set swing support at 21.725 for now.
**************************************************************************
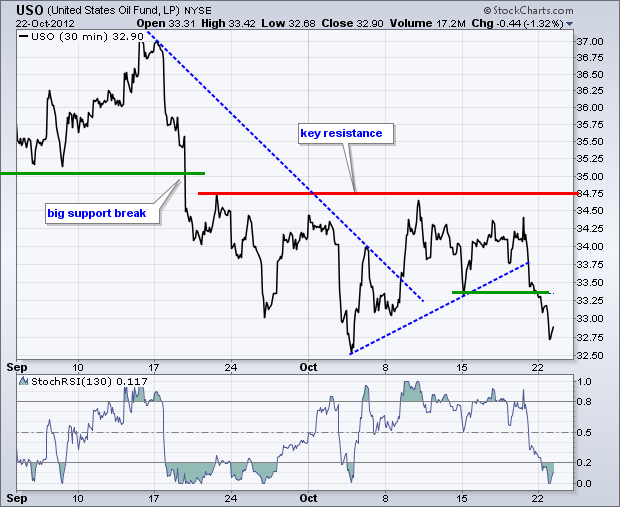
The US Oil Fund (USO) broke down in mid September and held this breakdown as broken support turned into resistance. With a sharp decline the last two days, USO broke short-term support from last week's low to signal a continuation lower. This breakdown further reinforces resistance in the 34.5-34.75 area.
**************************************************************************
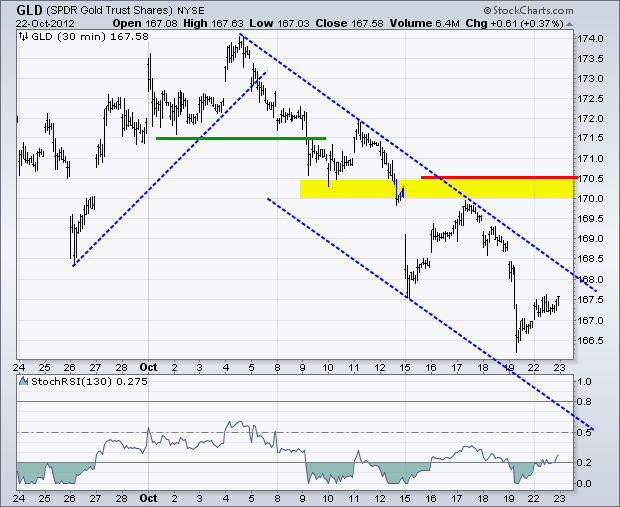
No change. The Gold SPDR (GLD) broke support in mid October and broken support turned into resistance mid week. With a move to new lows, GLD remains in a short-term downtrend. Even though this looks like a correction after the big August-September surge, we could see more correction towards the 162 area before all is said and done. Key resistance remains at 170.50 for now. Notice how StochRSI became oversold several times during this downtrend and never reached overbought levels.
**************************************************************************
Key Reports and Events:
Wed - Oct 24 - 07:00 - MBA Mortgage Index
Wed - Oct 24 - 10:00 - New Home Sales
Wed - Oct 24 - 10:00 - FHFA Housing Price Index
Wed - Oct 24 - 10:30 - Oil Inventories
Wed - Oct 24 - 14:15 - FOMC Policy Statement
Thu - Oct 25 - 08:30 - Jobless Claims
Thu - Oct 25 - 08:30 - Durable Goods Orders
Thu - Oct 25 - 10:00 - Pending Home Sales
Thu - Oct 25 - 16:00 – AAPL Earnings
Fri - Oct 26 - 08:30 - GDP
Fri - Oct 26 - 09:55 - Michigan Sentiment
Charts of Interest: Tuesday and Thursday
This commentary and charts-of-interest are designed to stimulate thinking. This analysis is not a recommendation to buy, sell, hold or sell short any security (stock ETF or otherwise). We all need to think for ourselves when it comes to trading our own accounts. First, it is the only way to really learn. Second, we are the only ones responsible for our decisions. Think of these charts as food for further analysis. Before making a trade, it is important to have a plan. Plan the trade and trade the plan. Among other things, this includes setting a trigger level, a target area and a stop-loss level. It is also important to plan for three possible price movements: advance, decline or sideways. Have a plan for all three scenarios BEFORE making the trade. Consider possible holding times. And finally, look at overall market conditions and sector/industry performance.


**************************************************************************
The 20+ Year T-Bond ETF (TLT) got an oversold bounce on Friday and hit resistance just below 122 on Monday. Treasuries lost some of their luster as stocks and the Euro firmed on Monday. The failure at 122 reinforces this level as key short-term resistance. A break above 122 and StochRSI break above .60 would reverse the short-term downtrend.

**************************************************************************
The US Dollar Fund (UUP) surged last week and then stalled in the 21.80 area. The short-term swing is up, but the bigger trend is down with key resistance at the October highs. The one-week trend line and Monday's low mark first support. I am going to add a little buffer and set swing support at 21.725 for now.

**************************************************************************
The US Oil Fund (USO) broke down in mid September and held this breakdown as broken support turned into resistance. With a sharp decline the last two days, USO broke short-term support from last week's low to signal a continuation lower. This breakdown further reinforces resistance in the 34.5-34.75 area.

**************************************************************************
No change. The Gold SPDR (GLD) broke support in mid October and broken support turned into resistance mid week. With a move to new lows, GLD remains in a short-term downtrend. Even though this looks like a correction after the big August-September surge, we could see more correction towards the 162 area before all is said and done. Key resistance remains at 170.50 for now. Notice how StochRSI became oversold several times during this downtrend and never reached overbought levels.

**************************************************************************
Key Reports and Events:
Wed - Oct 24 - 07:00 - MBA Mortgage Index
Wed - Oct 24 - 10:00 - New Home Sales
Wed - Oct 24 - 10:00 - FHFA Housing Price Index
Wed - Oct 24 - 10:30 - Oil Inventories
Wed - Oct 24 - 14:15 - FOMC Policy Statement
Thu - Oct 25 - 08:30 - Jobless Claims
Thu - Oct 25 - 08:30 - Durable Goods Orders
Thu - Oct 25 - 10:00 - Pending Home Sales
Thu - Oct 25 - 16:00 – AAPL Earnings
Fri - Oct 26 - 08:30 - GDP
Fri - Oct 26 - 09:55 - Michigan Sentiment
Charts of Interest: Tuesday and Thursday
This commentary and charts-of-interest are designed to stimulate thinking. This analysis is not a recommendation to buy, sell, hold or sell short any security (stock ETF or otherwise). We all need to think for ourselves when it comes to trading our own accounts. First, it is the only way to really learn. Second, we are the only ones responsible for our decisions. Think of these charts as food for further analysis. Before making a trade, it is important to have a plan. Plan the trade and trade the plan. Among other things, this includes setting a trigger level, a target area and a stop-loss level. It is also important to plan for three possible price movements: advance, decline or sideways. Have a plan for all three scenarios BEFORE making the trade. Consider possible holding times. And finally, look at overall market conditions and sector/industry performance.

About the author:
Arthur Hill, CMT, is the Chief Technical Strategist at TrendInvestorPro.com. Focusing predominantly on US equities and ETFs, his systematic approach of identifying trend, finding signals within the trend, and setting key price levels has made him an esteemed market technician. Arthur has written articles for numerous financial publications including Barrons and Stocks & Commodities Magazine. In addition to his Chartered Market Technician (CMT) designation, he holds an MBA from the Cass Business School at City University in London.
Learn More
