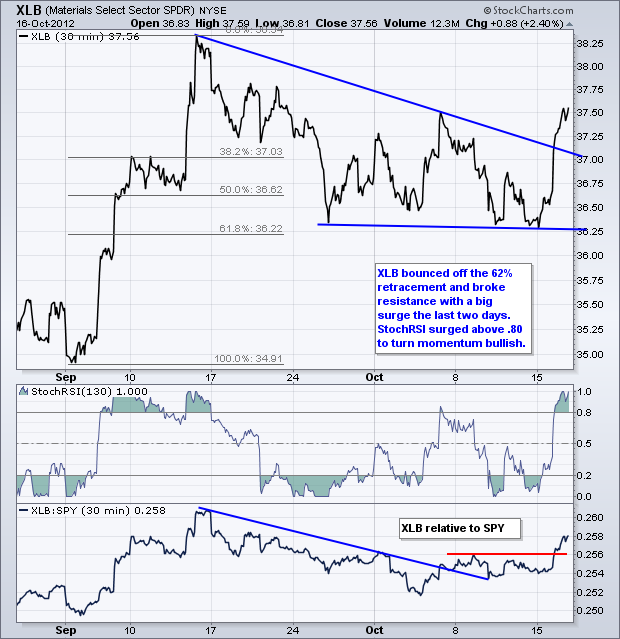
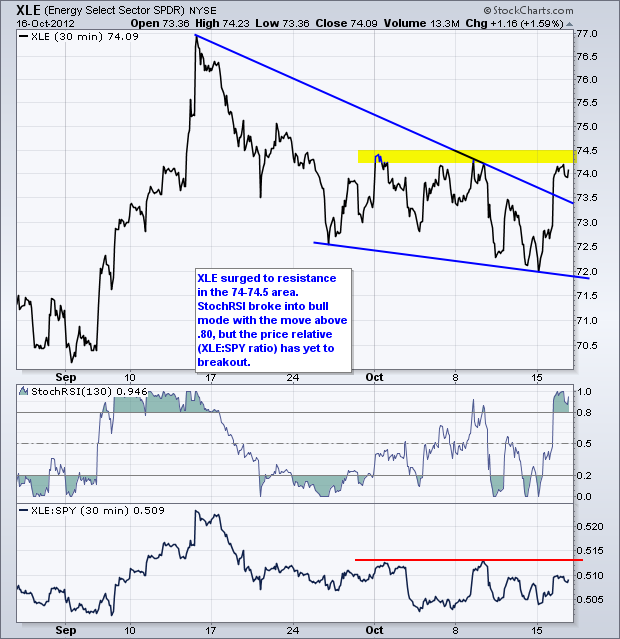
Stocks extended their oversold bounce with the Nasdaq 100 ETF (QQQ) leading the way. QQQ was one of the hardest hit and subsequently got the biggest rebound. All sectors were up with Basic Materials SPDR (XLB) surging 2.4% on the day. Energy was also strong as the Energy SPDR (XLE) advanced 1.59%. Steel stocks led the materials sector higher with big moves coming from CLF, NUE and STLD. The Metals & Mining SPDR (XME) extended its advance to keep the early September breakout and successful throwback alive.

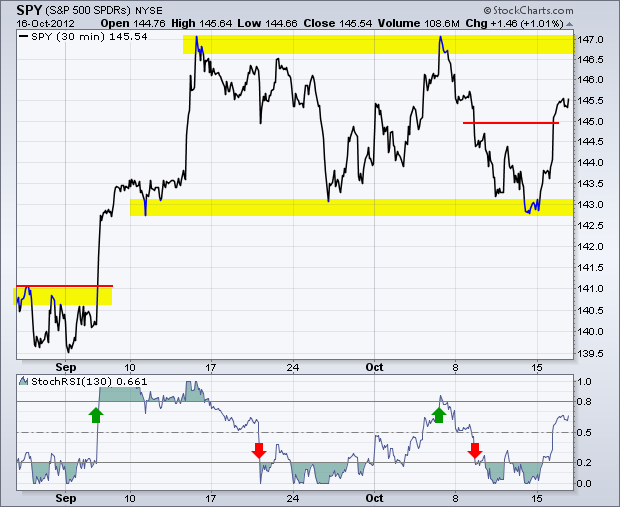
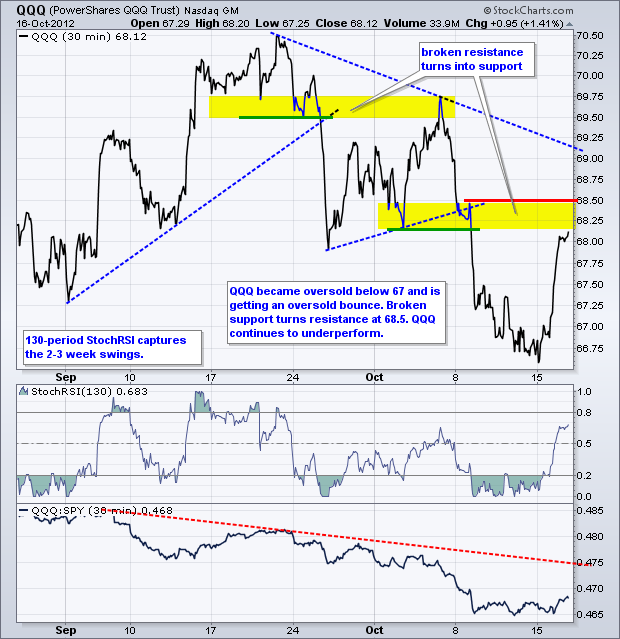
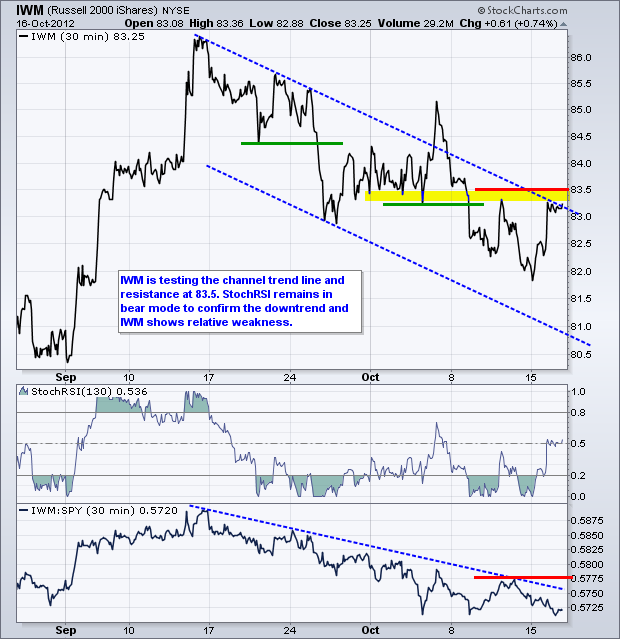
The S&P 500 ETF (SPY) surged off support with a big move the last two days. The swing within the trading range is now up, but StochRSI has yet to confirm with a break above .80 to turn momentum bullish. Moreover, I am hesitant to turn too bullish because SPY remains within a larger trading range the last 5-6 weeks. Also note that IWM and QQQ did not break resistance. At this point, I am treating the two day advance as an oversold bounce. SPY has been choppy since the second week of September, while IWM and QQQ have moved lower. This is enough to keep a bearish bias.
**************************************************************************
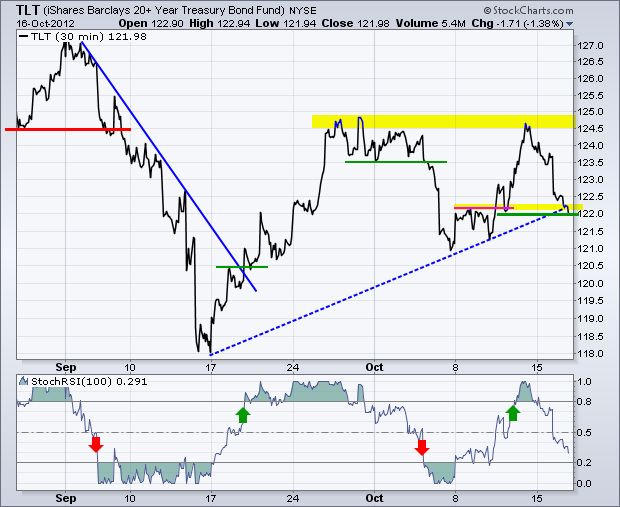
The 20+ Year T-Bond ETF (TLT) fell sharply as stocks and the Euro rallied. This was a classic risk-on day. With this decline, TLT failed at resistance and is now testing support in the 122 area. StochRSI declined sharply as well, but has yet to break below .20 to turn momentum bearish.
**************************************************************************
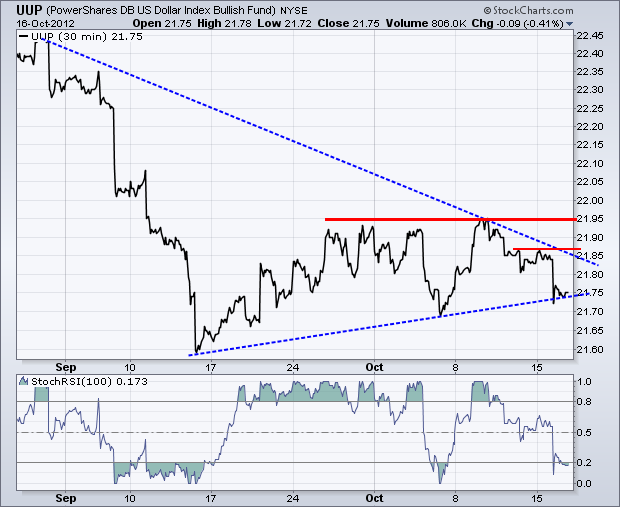
The US Dollar Fund (UUP) fell sharply as the Euro surged in the early afternoon. UUP is now testing support from the mid September trend line. More importantly, the ETF failed at resistance in the 21.95 area yet again. This week's high marks minor resistance and a rebound above this level would be positive. A real trend change is dependent on a break above the October highs though.
**************************************************************************
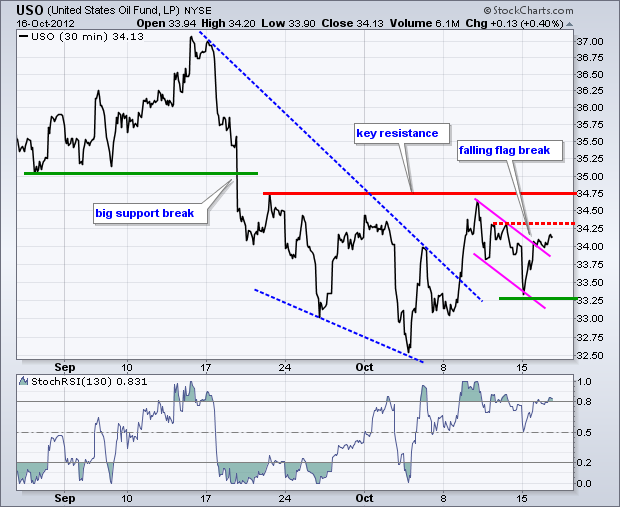
The US Oil Fund (USO) edged above the falling flag trend line, but did not surge and break first resistance on Tuesday. One would have expected more strength in oil because stocks and the Euro were strong. USO needs some follow through to break resistance and fully reverse the downtrend that started with the big support break in mid September.
**************************************************************************
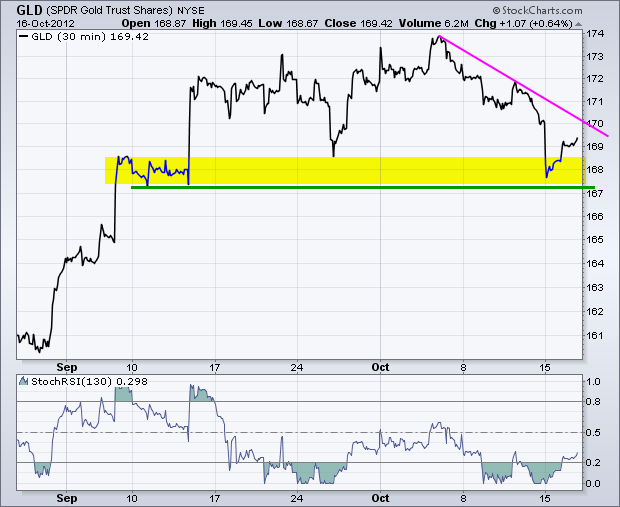
Like the S&P 500, the Gold SPDR (GLD) has been locked in a trading range since mid September. Support in the 167-168 area stems from the lows extending back to the second week of September. GLD plunged on Monday, but got a bounce off support as the Dollar weakened on Tuesday. The swing within this trading range remains down with the pink trend line marking first resistance in the 170.5 area.
**************************************************************************
Key Reports and Events:
Wed - Oct 17 - 07:00 - MBA Mortgage Index
Wed - Oct 17 - 08:30 - Housing Starts/Building Permits
Wed - Oct 17 - 10:30 - Oil Inventories
Thu - Oct 18 - 08:30 - Jobless Claims
Thu – Oct 18 – 09:00 – EU Summit
Thu - Oct 18 - 10:00 - Philadelphia Fed
Thu - Oct 18 - 10:00 - Leading Indicators
Fri – Oct 19 – 09:00 – EU Summit
Fri - Oct 19 - 10:00 - Existing Home Sales
Charts of Interest: Tuesday and Thursday
This commentary and charts-of-interest are designed to stimulate thinking. This analysis is not a recommendation to buy, sell, hold or sell short any security (stock ETF or otherwise). We all need to think for ourselves when it comes to trading our own accounts. First, it is the only way to really learn. Second, we are the only ones responsible for our decisions. Think of these charts as food for further analysis. Before making a trade, it is important to have a plan. Plan the trade and trade the plan. Among other things, this includes setting a trigger level, a target area and a stop-loss level. It is also important to plan for three possible price movements: advance, decline or sideways. Have a plan for all three scenarios BEFORE making the trade. Consider possible holding times. And finally, look at overall market conditions and sector/industry performance.


**************************************************************************
The 20+ Year T-Bond ETF (TLT) fell sharply as stocks and the Euro rallied. This was a classic risk-on day. With this decline, TLT failed at resistance and is now testing support in the 122 area. StochRSI declined sharply as well, but has yet to break below .20 to turn momentum bearish.

**************************************************************************
The US Dollar Fund (UUP) fell sharply as the Euro surged in the early afternoon. UUP is now testing support from the mid September trend line. More importantly, the ETF failed at resistance in the 21.95 area yet again. This week's high marks minor resistance and a rebound above this level would be positive. A real trend change is dependent on a break above the October highs though.

**************************************************************************
The US Oil Fund (USO) edged above the falling flag trend line, but did not surge and break first resistance on Tuesday. One would have expected more strength in oil because stocks and the Euro were strong. USO needs some follow through to break resistance and fully reverse the downtrend that started with the big support break in mid September.

**************************************************************************
Like the S&P 500, the Gold SPDR (GLD) has been locked in a trading range since mid September. Support in the 167-168 area stems from the lows extending back to the second week of September. GLD plunged on Monday, but got a bounce off support as the Dollar weakened on Tuesday. The swing within this trading range remains down with the pink trend line marking first resistance in the 170.5 area.

**************************************************************************
Key Reports and Events:
Wed - Oct 17 - 07:00 - MBA Mortgage Index
Wed - Oct 17 - 08:30 - Housing Starts/Building Permits
Wed - Oct 17 - 10:30 - Oil Inventories
Thu - Oct 18 - 08:30 - Jobless Claims
Thu – Oct 18 – 09:00 – EU Summit
Thu - Oct 18 - 10:00 - Philadelphia Fed
Thu - Oct 18 - 10:00 - Leading Indicators
Fri – Oct 19 – 09:00 – EU Summit
Fri - Oct 19 - 10:00 - Existing Home Sales
Charts of Interest: Tuesday and Thursday
This commentary and charts-of-interest are designed to stimulate thinking. This analysis is not a recommendation to buy, sell, hold or sell short any security (stock ETF or otherwise). We all need to think for ourselves when it comes to trading our own accounts. First, it is the only way to really learn. Second, we are the only ones responsible for our decisions. Think of these charts as food for further analysis. Before making a trade, it is important to have a plan. Plan the trade and trade the plan. Among other things, this includes setting a trigger level, a target area and a stop-loss level. It is also important to plan for three possible price movements: advance, decline or sideways. Have a plan for all three scenarios BEFORE making the trade. Consider possible holding times. And finally, look at overall market conditions and sector/industry performance.

About the author:
Arthur Hill, CMT, is the Chief Technical Strategist at TrendInvestorPro.com. Focusing predominantly on US equities and ETFs, his systematic approach of identifying trend, finding signals within the trend, and setting key price levels has made him an esteemed market technician. Arthur has written articles for numerous financial publications including Barrons and Stocks & Commodities Magazine. In addition to his Chartered Market Technician (CMT) designation, he holds an MBA from the Cass Business School at City University in London.
Learn More


