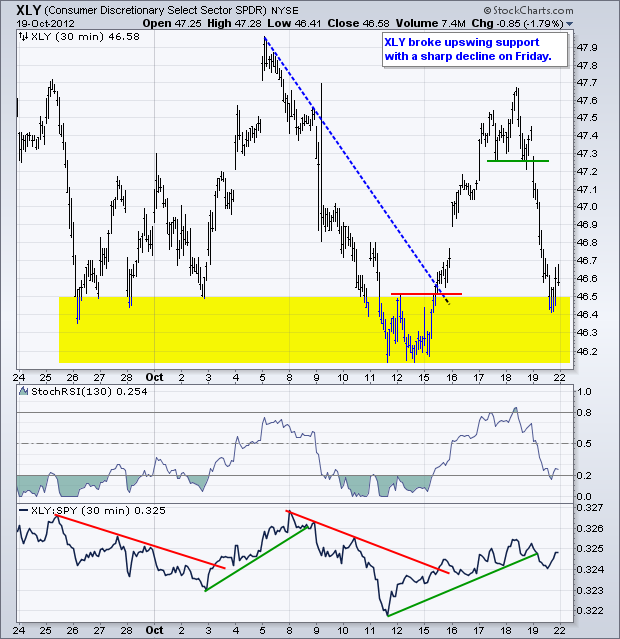
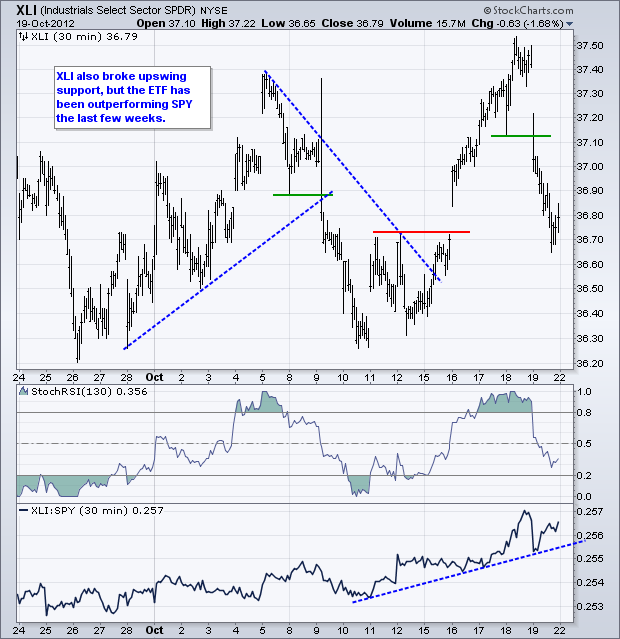
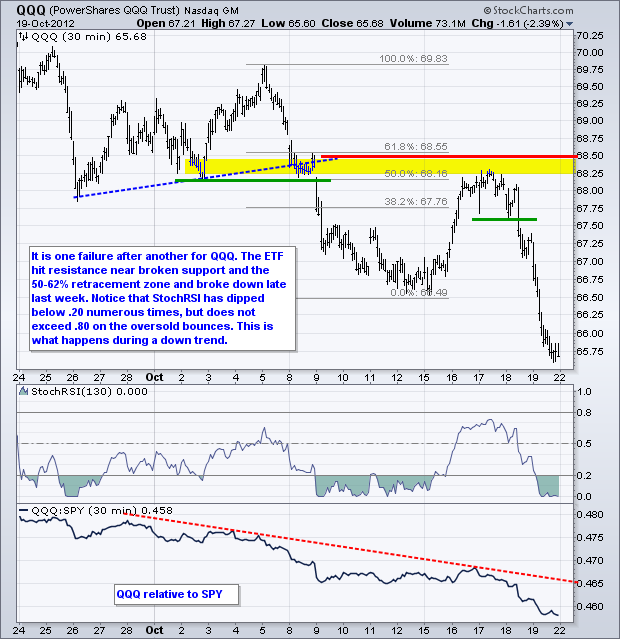
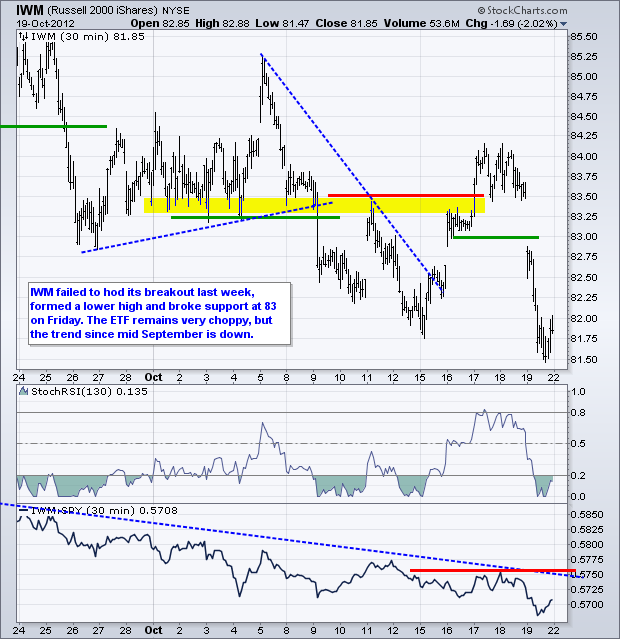
It was another rough week for the stock market, especially tech stocks. Even though the S&P 500 ETF (SPY) remains within a consolidation pattern since mid September, the Nasdaq 100 ETF (QQQ) is in a clear downtrend with a 6+ percent decline from its mid September high. Relative weakness in tech remains a big concern for the broader market. Even though the Consumer Discretionary SPDR (XLY) has held up the last few weeks, the SPDR was hit hard on Friday with a 1.79% decline. SPY will break consolidation support should weakness expand to other key sectors, such as XLI and XLY. XLY is currently testing support from the lows extending back to late September.

SPY surged above 145 early last week, stalled and then plunged back to support on Friday. Overall, the ETF is stuck between range support in the 142.75-143 area and range resistance in the 147 area. A lower high did formed last week and this indicates that buying pressure is weakening. Combined with a surge in selling pressure on Friday, we could see a range break and medium-term trend reversal.
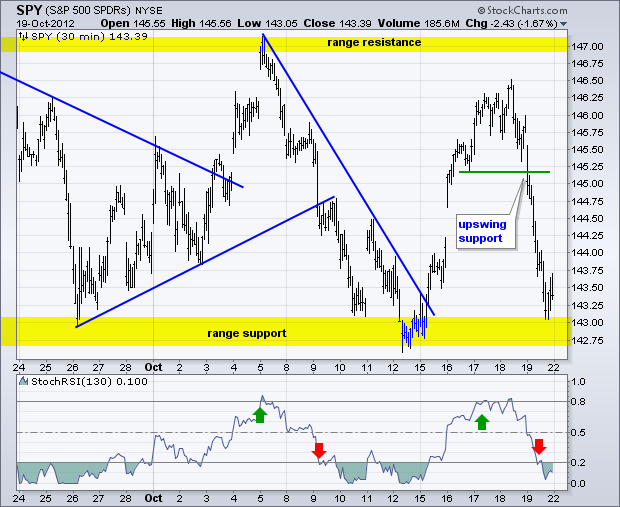
The indicator window shows StochRSI hitting .80 near the consolidation peaks and dipping below .20 near the consolidation boundaries. There are two ways to use most momentum oscillators. During a consolidation or trading range, overbought conditions mark swing tops and oversold conditions mark swing bottoms. During a downtrend, the oscillator will often become oversold and fail to reach overbought levels during bounces. During an uptrend, the oscillator will often become overbought and a fail to reach oversold levels during pullbacks. SPY is trendless since mid September, but some sort of trend will emerge one day. For now, the swings are dominant and the current swing is down.
**************************************************************************
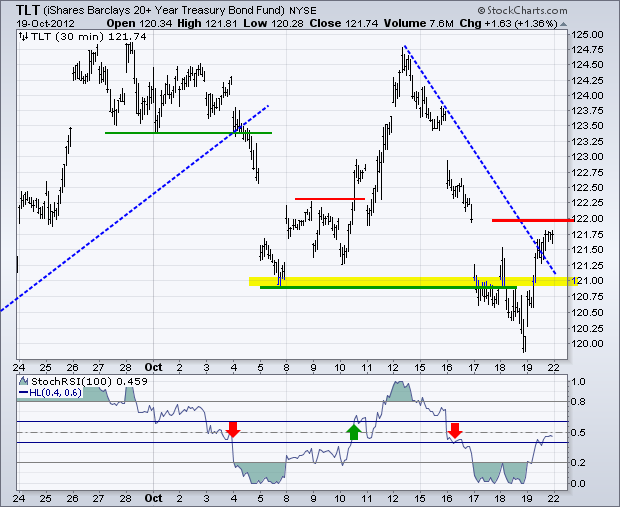
The 20+ Year T-Bond ETF (TLT) got an oversold bounce as stocks plunged on Friday. The trend since late July is down, but the ETF is trying to firm in the 121 area. TLT broke below this low (support) mid week and then recovered with a sharp surge on Friday. This failed support break could be a bear trap and a follow thru break above 122 would reverse last week's downswing. The indicator window shows third way to use StochRSI by marking momentum support at .40 and resistance at .60. A break above .60 is bullish until there is a break below .40 and visa versa. Note that the Fed meets this week so treasuries will be on the hot seat Wednesday.
**************************************************************************
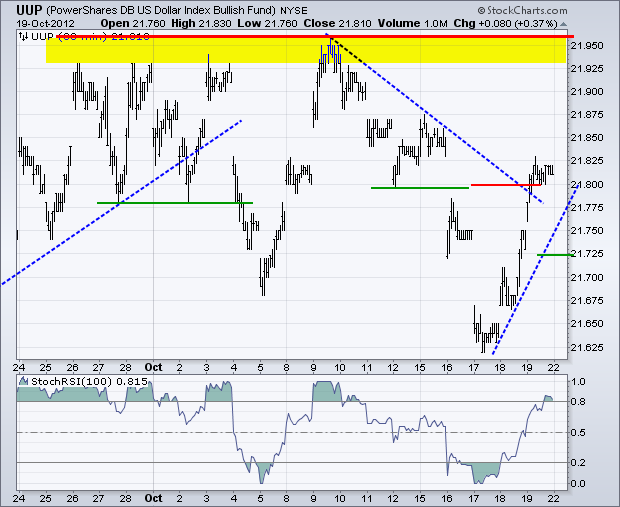
The US Dollar Fund (UUP) is all over the place as the markets started the week in risk-on mode and ended the week in risk-off mode. Like SPY, the Dollar has been locked in a trading range since mid September. A move above the October highs is needed to break range resistance and reverse the bigger downtrend. With a big bounce the last two days, the swing within this trading range is up and I am marking support at 21.725 for now.
**************************************************************************
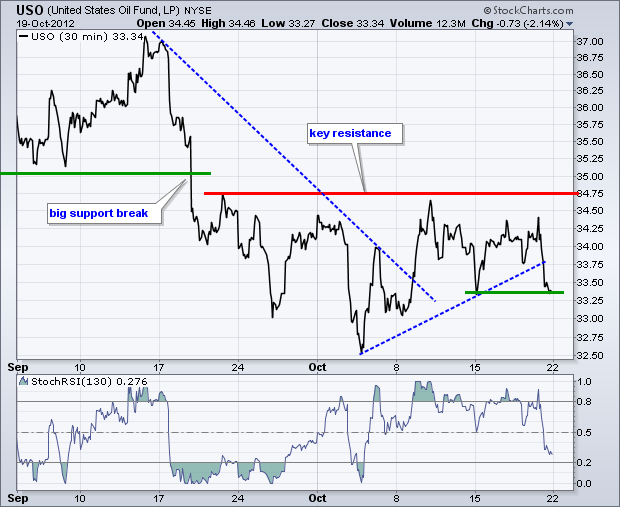
The US Oil Fund (USO) broke down in mid September and this breakdown remains bearish. In other words, it has yet to be proven otherwise. Broken support turned into resistance and held the last four weeks. Oil came under selling pressure on Friday as stocks weakened and the Dollar strengthened. USO broke the early October trend line and is now testing support from the mid October low.
**************************************************************************
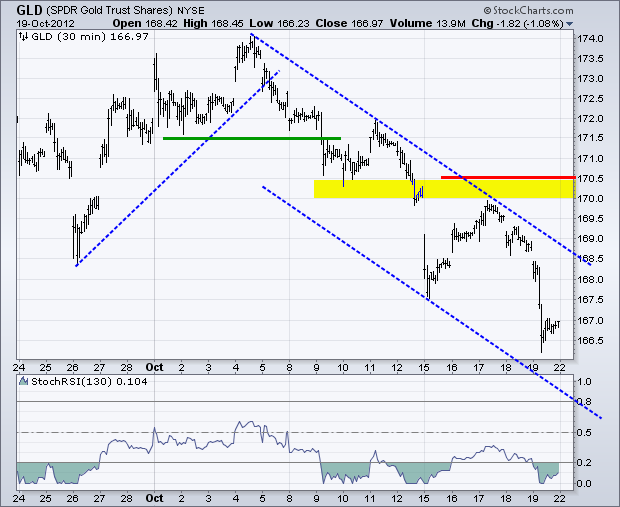
The Gold SPDR (GLD) broke support in mid October and broken support turned into resistance mid week. With a move to new lows, GLD remains in a short-term downtrend. Even though this looks like a correction after the big August-September surge, we could see more correction towards the 162 area before all is said and done. Key resistance remains at 170.50 for now. Notice how StochRSI become oversold several times during this downtrend and never reached overbought levels.
**************************************************************************
Key Reports and Events:
Wed - Oct 24 - 07:00 - MBA Mortgage Index
Wed - Oct 24 - 10:00 - New Home Sales
Wed - Oct 24 - 10:00 - FHFA Housing Price Index
Wed - Oct 24 - 10:30 - Oil Inventories
Wed - Oct 24 - 14:15 - FOMC Policy Statement
Thu - Oct 25 - 08:30 - Jobless Claims
Thu - Oct 25 - 08:30 - Durable Goods Orders
Thu - Oct 25 - 10:00 - Pending Home Sales
Fri - Oct 26 - 08:30 - GDP
Fri - Oct 26 - 09:55 - Michigan Sentiment
Charts of Interest: Tuesday and Thursday
This commentary and charts-of-interest are designed to stimulate thinking. This analysis is not a recommendation to buy, sell, hold or sell short any security (stock ETF or otherwise). We all need to think for ourselves when it comes to trading our own accounts. First, it is the only way to really learn. Second, we are the only ones responsible for our decisions. Think of these charts as food for further analysis. Before making a trade, it is important to have a plan. Plan the trade and trade the plan. Among other things, this includes setting a trigger level, a target area and a stop-loss level. It is also important to plan for three possible price movements: advance, decline or sideways. Have a plan for all three scenarios BEFORE making the trade. Consider possible holding times. And finally, look at overall market conditions and sector/industry performance.

The indicator window shows StochRSI hitting .80 near the consolidation peaks and dipping below .20 near the consolidation boundaries. There are two ways to use most momentum oscillators. During a consolidation or trading range, overbought conditions mark swing tops and oversold conditions mark swing bottoms. During a downtrend, the oscillator will often become oversold and fail to reach overbought levels during bounces. During an uptrend, the oscillator will often become overbought and a fail to reach oversold levels during pullbacks. SPY is trendless since mid September, but some sort of trend will emerge one day. For now, the swings are dominant and the current swing is down.


**************************************************************************
The 20+ Year T-Bond ETF (TLT) got an oversold bounce as stocks plunged on Friday. The trend since late July is down, but the ETF is trying to firm in the 121 area. TLT broke below this low (support) mid week and then recovered with a sharp surge on Friday. This failed support break could be a bear trap and a follow thru break above 122 would reverse last week's downswing. The indicator window shows third way to use StochRSI by marking momentum support at .40 and resistance at .60. A break above .60 is bullish until there is a break below .40 and visa versa. Note that the Fed meets this week so treasuries will be on the hot seat Wednesday.

**************************************************************************
The US Dollar Fund (UUP) is all over the place as the markets started the week in risk-on mode and ended the week in risk-off mode. Like SPY, the Dollar has been locked in a trading range since mid September. A move above the October highs is needed to break range resistance and reverse the bigger downtrend. With a big bounce the last two days, the swing within this trading range is up and I am marking support at 21.725 for now.

**************************************************************************
The US Oil Fund (USO) broke down in mid September and this breakdown remains bearish. In other words, it has yet to be proven otherwise. Broken support turned into resistance and held the last four weeks. Oil came under selling pressure on Friday as stocks weakened and the Dollar strengthened. USO broke the early October trend line and is now testing support from the mid October low.

**************************************************************************
The Gold SPDR (GLD) broke support in mid October and broken support turned into resistance mid week. With a move to new lows, GLD remains in a short-term downtrend. Even though this looks like a correction after the big August-September surge, we could see more correction towards the 162 area before all is said and done. Key resistance remains at 170.50 for now. Notice how StochRSI become oversold several times during this downtrend and never reached overbought levels.

**************************************************************************
Key Reports and Events:
Wed - Oct 24 - 07:00 - MBA Mortgage Index
Wed - Oct 24 - 10:00 - New Home Sales
Wed - Oct 24 - 10:00 - FHFA Housing Price Index
Wed - Oct 24 - 10:30 - Oil Inventories
Wed - Oct 24 - 14:15 - FOMC Policy Statement
Thu - Oct 25 - 08:30 - Jobless Claims
Thu - Oct 25 - 08:30 - Durable Goods Orders
Thu - Oct 25 - 10:00 - Pending Home Sales
Fri - Oct 26 - 08:30 - GDP
Fri - Oct 26 - 09:55 - Michigan Sentiment
Charts of Interest: Tuesday and Thursday
This commentary and charts-of-interest are designed to stimulate thinking. This analysis is not a recommendation to buy, sell, hold or sell short any security (stock ETF or otherwise). We all need to think for ourselves when it comes to trading our own accounts. First, it is the only way to really learn. Second, we are the only ones responsible for our decisions. Think of these charts as food for further analysis. Before making a trade, it is important to have a plan. Plan the trade and trade the plan. Among other things, this includes setting a trigger level, a target area and a stop-loss level. It is also important to plan for three possible price movements: advance, decline or sideways. Have a plan for all three scenarios BEFORE making the trade. Consider possible holding times. And finally, look at overall market conditions and sector/industry performance.

About the author:
Arthur Hill, CMT, is the Chief Technical Strategist at TrendInvestorPro.com. Focusing predominantly on US equities and ETFs, his systematic approach of identifying trend, finding signals within the trend, and setting key price levels has made him an esteemed market technician. Arthur has written articles for numerous financial publications including Barrons and Stocks & Commodities Magazine. In addition to his Chartered Market Technician (CMT) designation, he holds an MBA from the Cass Business School at City University in London.
Learn More


