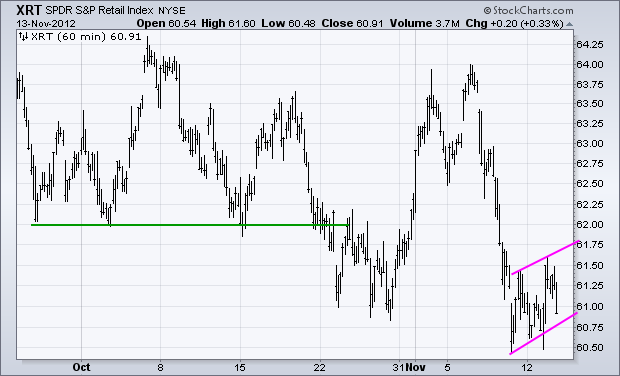
Stocks continued to struggle as buyers found little reason to bottom pick on Tuesday. Stocks opened lower, surged in morning trade and then moved lower in the afternoon. The major index ETFs finished with small losses on the day. Seven of the nine sectors were lower with the Finance SPDR (XLF) and Technology SPDR (XLK) leading the way. The Consumer Discretionary SPDR (XLY) and the Utilities SPDR (XLU) bucked the trend with small gains. Strength in retailers helped the consumer discretionary sector. The chart below shows the Retail SPDR (XRT) plunging last week and then forming a rising flag the last few days. A break below 60.7 would signal a continuation lower. A move above 61.75 would negate this flag and be short-term bullish. Keep in mind, however, that the trend since mid September is down with a series of falling peaks and troughs. A breakout on the 60-minute chart would signal an upswing within this bigger downtrend.

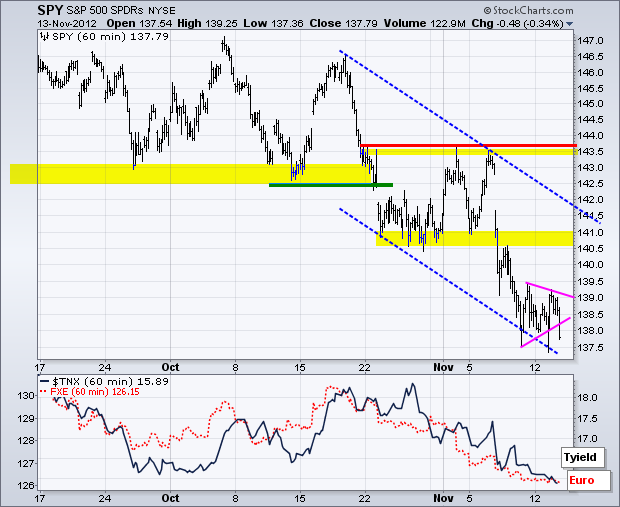
On the 30-minute chart, the S&P 500 ETF (SPY) plunged last week and then consolidated with a triangle. Late selling pressure pushed the ETF below triangle support at the close. Even though this signals a continuation lower, keep in mind that the ETF is still oversold and we could see more chop than direction. A surge above 139.5 would break the triangle trend line and argue for an oversold bounce towards the 141 area.
**************************************************************************
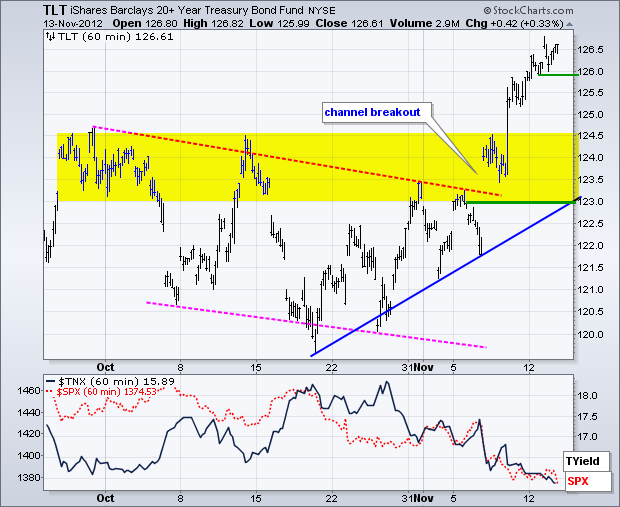
A bounce in the stock market is unlikely as long as treasuries remain strong. The 20+ Year T-Bond ETF (TLT), however, is as overbought as stocks are oversold. TLT closed strong on Tuesday because stocks closed weak. A move below 125.9 would signal some weakness that could lead to pullback. There are a few resistance levels between 123 and 124.5 that could turn into support on any pullback.
**************************************************************************
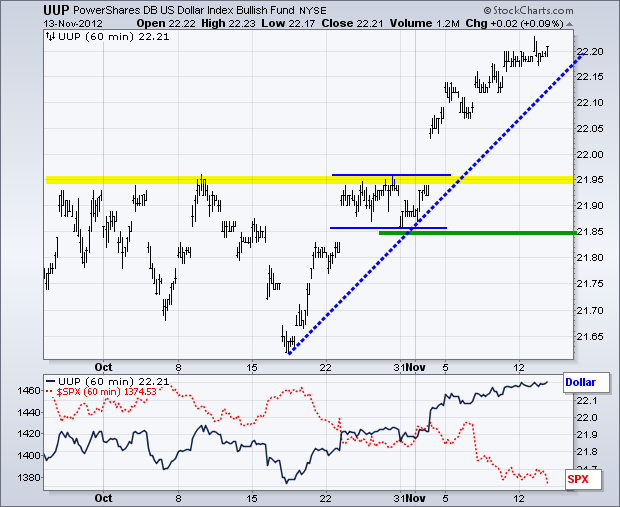
No change. The US Dollar Fund (UUP) broke resistance with a big move in early November and edged higher the last few days. The breakout is bullish and holding. Broken resistance turns into first support in the 21.95 area. Key support remains at 21.85 for now. A pullback in the greenback could help gold, oil and stocks, but further strength would be bearish for all three.
**************************************************************************
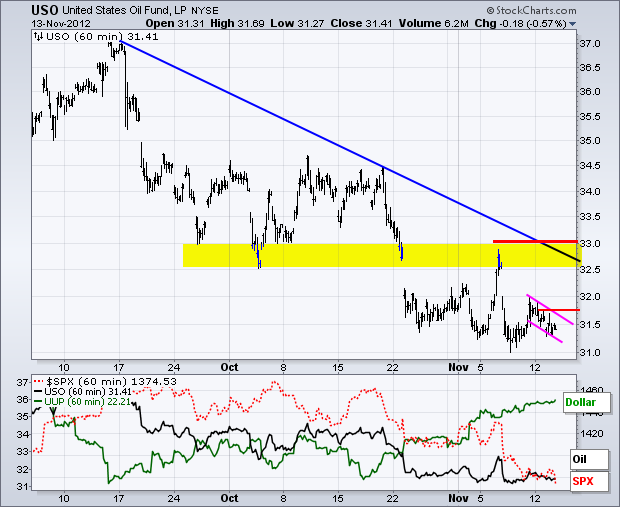
The US Oil Fund (USO) plunged in late October and then firmed in the 31.5 area for the last 2-3 weeks. The trend is down, but oil is holding up relatively well considering recent weakness in the stock market and strength in the Dollar. After a small oversold bounce last week, the ETF formed a small falling flag this week and a break above 31.8 would argue for an oversold bounce.
**************************************************************************
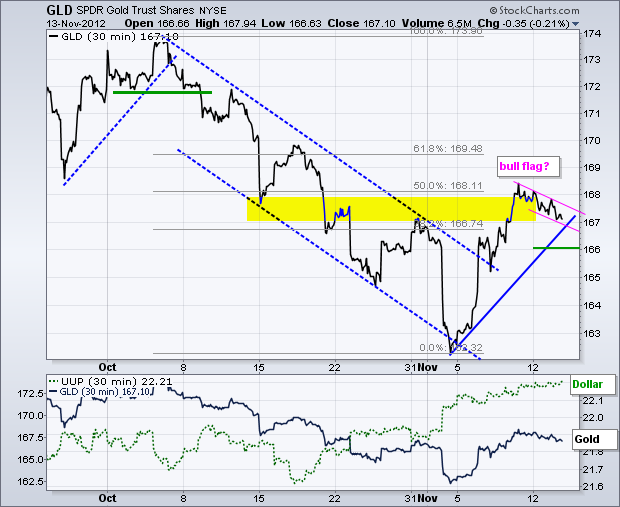
The Gold SPDR (GLD) is at a moment-of-truth. The ETF is consolidating in the 38-50% retracement zone. A small falling flag is taking shape and a break above 168 would signal a continuation higher. The swing since early November is up with support marked at 166.
**************************************************************************
Key Reports and Events:
Wed - Nov 14 - 07:00 - MBA Mortgage Index
Wed - Nov 14 - 08:30 - Retail Sales
Wed - Nov 14 - 08:30 – Producer Price Index (PPI)
Wed - Nov 14 - 10:00 - Business Inventories
Wed - Nov 14 - 14:00 - FOMC Minutes
Thu - Nov 15 - 08:30 – Jobless Claims
Thu - Nov 15 - 08:30 – Consumer Price Index (CPI)
Thu - Nov 15 - 08:30 - Empire Manufacturing
Thu - Nov 15 - 10:00 - Philadelphia Fed
Thu - Nov 15 - 11:00 - Crude Inventories
Fri - Nov 16 - 09:15 - Industrial Production
Charts of Interest: Tuesday and Thursday
This commentary and charts-of-interest are designed to stimulate thinking. This analysis is not a recommendation to buy, sell, hold or sell short any security (stock ETF or otherwise). We all need to think for ourselves when it comes to trading our own accounts. First, it is the only way to really learn. Second, we are the only ones responsible for our decisions. Think of these charts as food for further analysis. Before making a trade, it is important to have a plan. Plan the trade and trade the plan. Among other things, this includes setting a trigger level, a target area and a stop-loss level. It is also important to plan for three possible price movements: advance, decline or sideways. Have a plan for all three scenarios BEFORE making the trade. Consider possible holding times. And finally, look at overall market conditions and sector/industry performance.


**************************************************************************
A bounce in the stock market is unlikely as long as treasuries remain strong. The 20+ Year T-Bond ETF (TLT), however, is as overbought as stocks are oversold. TLT closed strong on Tuesday because stocks closed weak. A move below 125.9 would signal some weakness that could lead to pullback. There are a few resistance levels between 123 and 124.5 that could turn into support on any pullback.

**************************************************************************
No change. The US Dollar Fund (UUP) broke resistance with a big move in early November and edged higher the last few days. The breakout is bullish and holding. Broken resistance turns into first support in the 21.95 area. Key support remains at 21.85 for now. A pullback in the greenback could help gold, oil and stocks, but further strength would be bearish for all three.

**************************************************************************
The US Oil Fund (USO) plunged in late October and then firmed in the 31.5 area for the last 2-3 weeks. The trend is down, but oil is holding up relatively well considering recent weakness in the stock market and strength in the Dollar. After a small oversold bounce last week, the ETF formed a small falling flag this week and a break above 31.8 would argue for an oversold bounce.

**************************************************************************
The Gold SPDR (GLD) is at a moment-of-truth. The ETF is consolidating in the 38-50% retracement zone. A small falling flag is taking shape and a break above 168 would signal a continuation higher. The swing since early November is up with support marked at 166.

**************************************************************************
Key Reports and Events:
Wed - Nov 14 - 07:00 - MBA Mortgage Index
Wed - Nov 14 - 08:30 - Retail Sales
Wed - Nov 14 - 08:30 – Producer Price Index (PPI)
Wed - Nov 14 - 10:00 - Business Inventories
Wed - Nov 14 - 14:00 - FOMC Minutes
Thu - Nov 15 - 08:30 – Jobless Claims
Thu - Nov 15 - 08:30 – Consumer Price Index (CPI)
Thu - Nov 15 - 08:30 - Empire Manufacturing
Thu - Nov 15 - 10:00 - Philadelphia Fed
Thu - Nov 15 - 11:00 - Crude Inventories
Fri - Nov 16 - 09:15 - Industrial Production
Charts of Interest: Tuesday and Thursday
This commentary and charts-of-interest are designed to stimulate thinking. This analysis is not a recommendation to buy, sell, hold or sell short any security (stock ETF or otherwise). We all need to think for ourselves when it comes to trading our own accounts. First, it is the only way to really learn. Second, we are the only ones responsible for our decisions. Think of these charts as food for further analysis. Before making a trade, it is important to have a plan. Plan the trade and trade the plan. Among other things, this includes setting a trigger level, a target area and a stop-loss level. It is also important to plan for three possible price movements: advance, decline or sideways. Have a plan for all three scenarios BEFORE making the trade. Consider possible holding times. And finally, look at overall market conditions and sector/industry performance.

About the author:
Arthur Hill, CMT, is the Chief Technical Strategist at TrendInvestorPro.com. Focusing predominantly on US equities and ETFs, his systematic approach of identifying trend, finding signals within the trend, and setting key price levels has made him an esteemed market technician. Arthur has written articles for numerous financial publications including Barrons and Stocks & Commodities Magazine. In addition to his Chartered Market Technician (CMT) designation, he holds an MBA from the Cass Business School at City University in London.
Learn More


