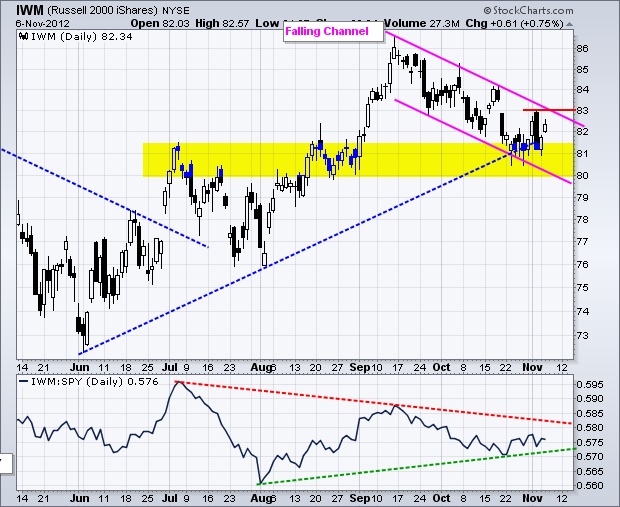
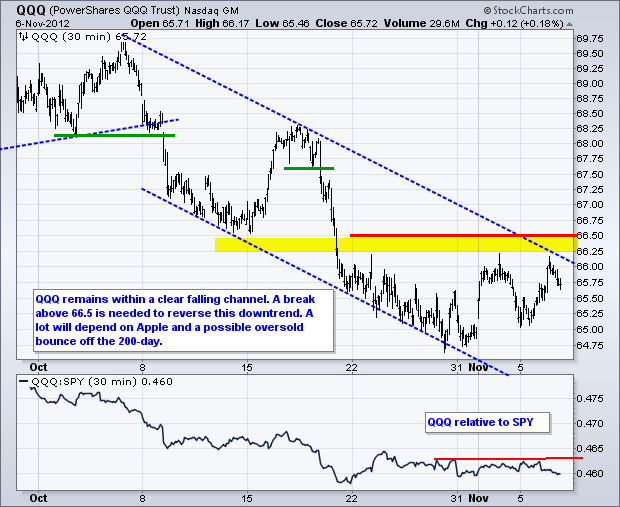
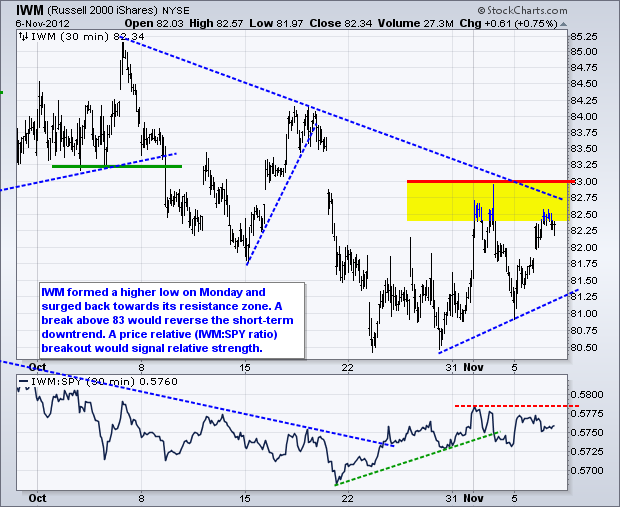
The markets embraced a little pre-election risk on Tuesday with the Dow Industrials SPDR (DIA) and S&P MidCap 400 SPDR (MDY) leading the way. The gains were modest, the election is over and investors can now turn to the next big issue (the fiscal cliff?). Energy, finance, materials and industrials led the sectors with gains exceeding 1%. The Airline ETF (FAA), Steel ETF (SLX) and Gold Miners ETF (GDX) posed gains of 2% of greater. Even though the Dollar was only down slightly, oil and gold surged with big oversold bounces. Treasuries declined as stocks gained. TLT is nearing a support test and a breakdown would be quite bullish for stocks. For stocks, I am still watching the falling channels in IWM and QQQ for breakouts that would reverse the eight week downtrend. The chart below shows IWM firming at support, but short of a breakout that would negate Friday's long black candlestick.

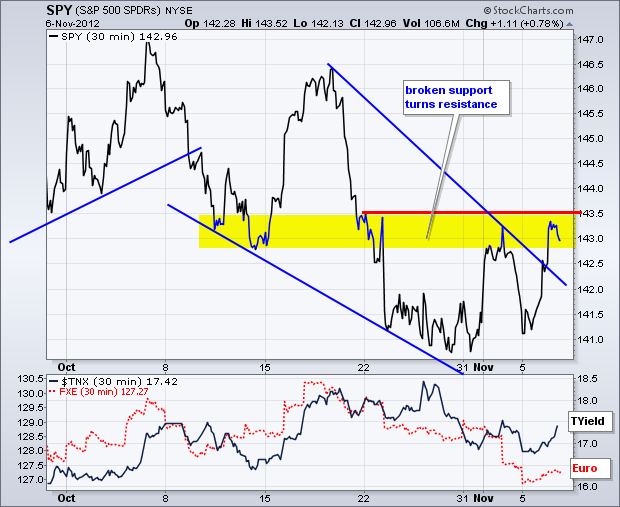
SPY surged to broken support and is challenging resistance in the 143-143.5 area again. A follow through breakout would be short-term bullish and reverse the short-term downtrend. I would like to see confirmation from treasuries. Look for the 10-year Treasury Yield ($TNX) to break above its early November high for confirmation. Note that treasury yields and stocks are positively correlated.
**************************************************************************
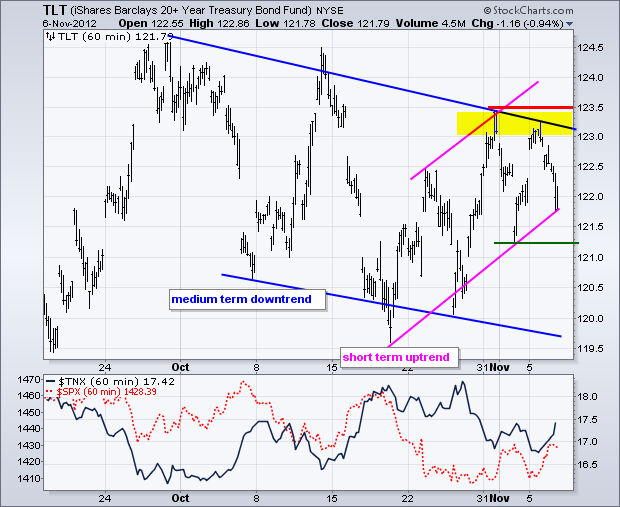
The 20+ Year T-Bond ETF (TLT) surged to resistance on Monday and then declined to upswing support on Tuesday. The trend since late September is clearly down. Also note that the trend since late July is down. The short-term swing is up since late October, but TLT is testing the late October trend line and support in the 121.5 area. A break below the early November low would be short-term bearish and signal a continuation of the bigger downtrends. Such a move would be bullish for stocks. A move above 123.5 would break a significant resistance level and be bearish for stocks.
**************************************************************************
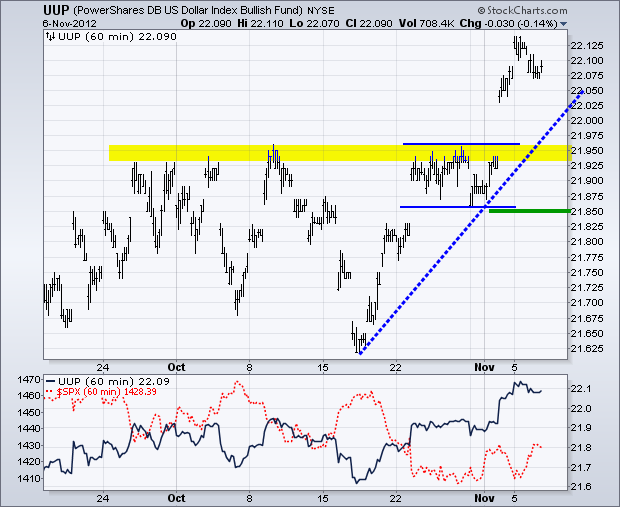
No change. The US Dollar Fund (UUP) surged to resistance in late October, consolidated and broke out with a surge on Friday. Perhaps the prospects of less quantitative easing triggered this buying binge. An improving economy and labor market put less pressure on the Fed for quantitative easing, which means less Dollar dilution. I am showing a longer 60-minute chart to highlight the magnitude of this breakout, which is medium-term bullish. Broken resistance turns first support in the 21.95 area. Key support is set at 21.85 for now.
**************************************************************************
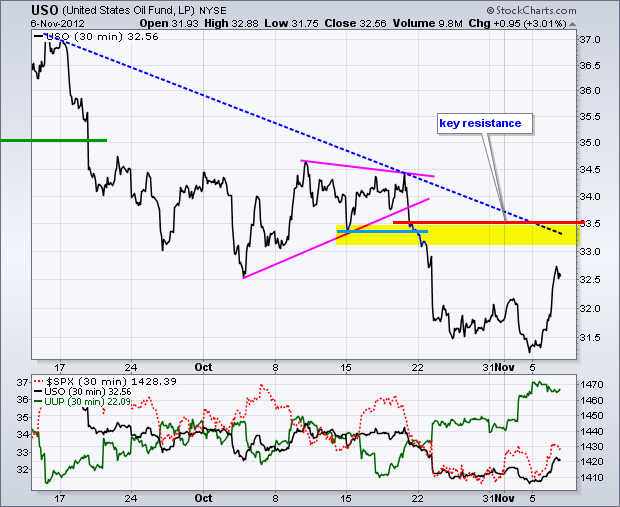
The US Oil Fund (USO) surged above last week's high, but remains within a downtrend since mid September. Keep in mind that oil was quite oversold after a 15% decline in seven weeks. Broken support and the mid September trend line combine to mark key resistance in the 33-33.5 area. Watch the Dollar and stock market for clues on oil.
**************************************************************************
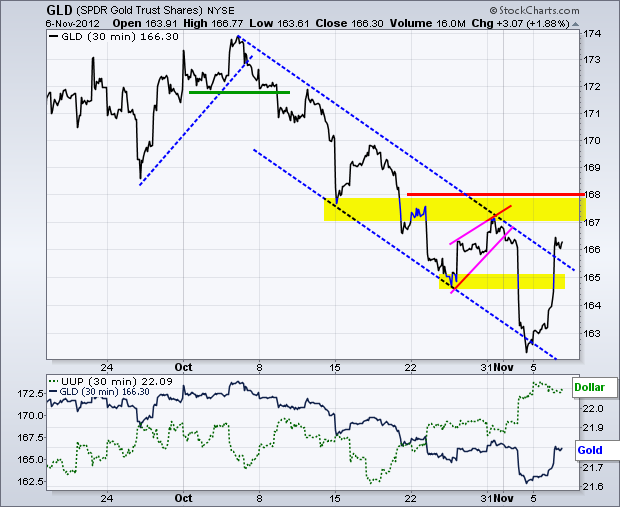
The Gold SPDR (GLD) got a big surge with a break above the channel trend line. This is positive, but still within the confines of a bigger downtrend. Broken support and the wedge high combine to mark resistance in the 167-168 area. A follow through break above this level is needed to fully reverse the downtrend. Watch the Dollar for clues.
**************************************************************************
Key Reports and Events:
Wed - Nov 07 - 07:00 - MBA Mortgage Index
Wed - Nov 07 - 10:30 - Oil Inventories
Thu - Nov 08 - 08:30 - Jobless Claims
Fri - Nov 09 - 09:55 - Michigan Sentiment
Charts of Interest: Tuesday and Thursday
This commentary and charts-of-interest are designed to stimulate thinking. This analysis is not a recommendation to buy, sell, hold or sell short any security (stock ETF or otherwise). We all need to think for ourselves when it comes to trading our own accounts. First, it is the only way to really learn. Second, we are the only ones responsible for our decisions. Think of these charts as food for further analysis. Before making a trade, it is important to have a plan. Plan the trade and trade the plan. Among other things, this includes setting a trigger level, a target area and a stop-loss level. It is also important to plan for three possible price movements: advance, decline or sideways. Have a plan for all three scenarios BEFORE making the trade. Consider possible holding times. And finally, look at overall market conditions and sector/industry performance.


**************************************************************************
The 20+ Year T-Bond ETF (TLT) surged to resistance on Monday and then declined to upswing support on Tuesday. The trend since late September is clearly down. Also note that the trend since late July is down. The short-term swing is up since late October, but TLT is testing the late October trend line and support in the 121.5 area. A break below the early November low would be short-term bearish and signal a continuation of the bigger downtrends. Such a move would be bullish for stocks. A move above 123.5 would break a significant resistance level and be bearish for stocks.

**************************************************************************
No change. The US Dollar Fund (UUP) surged to resistance in late October, consolidated and broke out with a surge on Friday. Perhaps the prospects of less quantitative easing triggered this buying binge. An improving economy and labor market put less pressure on the Fed for quantitative easing, which means less Dollar dilution. I am showing a longer 60-minute chart to highlight the magnitude of this breakout, which is medium-term bullish. Broken resistance turns first support in the 21.95 area. Key support is set at 21.85 for now.

**************************************************************************
The US Oil Fund (USO) surged above last week's high, but remains within a downtrend since mid September. Keep in mind that oil was quite oversold after a 15% decline in seven weeks. Broken support and the mid September trend line combine to mark key resistance in the 33-33.5 area. Watch the Dollar and stock market for clues on oil.

**************************************************************************
The Gold SPDR (GLD) got a big surge with a break above the channel trend line. This is positive, but still within the confines of a bigger downtrend. Broken support and the wedge high combine to mark resistance in the 167-168 area. A follow through break above this level is needed to fully reverse the downtrend. Watch the Dollar for clues.

**************************************************************************
Key Reports and Events:
Wed - Nov 07 - 07:00 - MBA Mortgage Index
Wed - Nov 07 - 10:30 - Oil Inventories
Thu - Nov 08 - 08:30 - Jobless Claims
Fri - Nov 09 - 09:55 - Michigan Sentiment
Charts of Interest: Tuesday and Thursday
This commentary and charts-of-interest are designed to stimulate thinking. This analysis is not a recommendation to buy, sell, hold or sell short any security (stock ETF or otherwise). We all need to think for ourselves when it comes to trading our own accounts. First, it is the only way to really learn. Second, we are the only ones responsible for our decisions. Think of these charts as food for further analysis. Before making a trade, it is important to have a plan. Plan the trade and trade the plan. Among other things, this includes setting a trigger level, a target area and a stop-loss level. It is also important to plan for three possible price movements: advance, decline or sideways. Have a plan for all three scenarios BEFORE making the trade. Consider possible holding times. And finally, look at overall market conditions and sector/industry performance.

About the author:
Arthur Hill, CMT, is the Chief Technical Strategist at TrendInvestorPro.com. Focusing predominantly on US equities and ETFs, his systematic approach of identifying trend, finding signals within the trend, and setting key price levels has made him an esteemed market technician. Arthur has written articles for numerous financial publications including Barrons and Stocks & Commodities Magazine. In addition to his Chartered Market Technician (CMT) designation, he holds an MBA from the Cass Business School at City University in London.
Learn More


