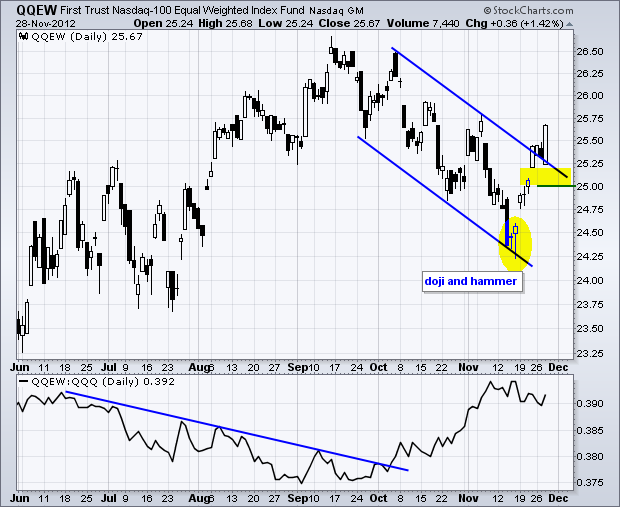
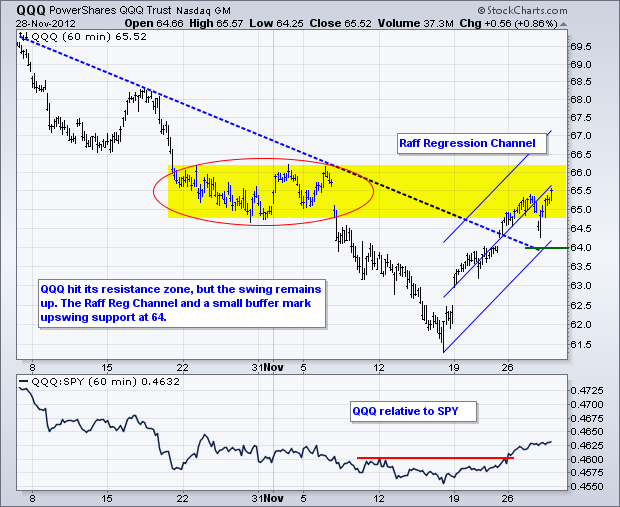
Stocks started the day weak as the major index ETFs gapped down on the open. This gap did not last long as stocks rallied the rest of the day and closed higher. The actual gains were not huge, but the ability to rally after a gap down shows resilience. The Nasdaq 100 Equal-Weight ETF (QQEW) led the way with a 1.42% gain. In contrast, the Nasdaq 100 ETF (QQQ) gained just .86% on the day. The chart below shows QQEW breaking channel resistance with a surge above 25.5 on Wednesday. Broken resistance turns into a support zone with upswing support set at 25.

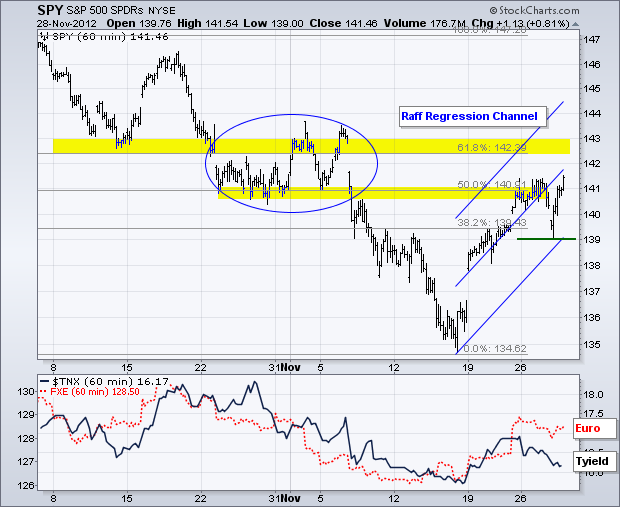
On the 60-minute chart for SPY, the ETF dipped to support at 139 on the open and promptly rallied above 141 by the close. The swing remains up since 19-November and Wednesday's low reinforces short-term support. With a new closing high, I extended the Raff Regression Channel, which extends from the 16-Nov closing low to the 28-Nov closing high. Key support remains at 139. Even though the swing is clearly up, keep in mind that SPY is in a big resistance zone marked by the 50-61.80% retracements and the prior consolidation (blue oval).
**************************************************************************
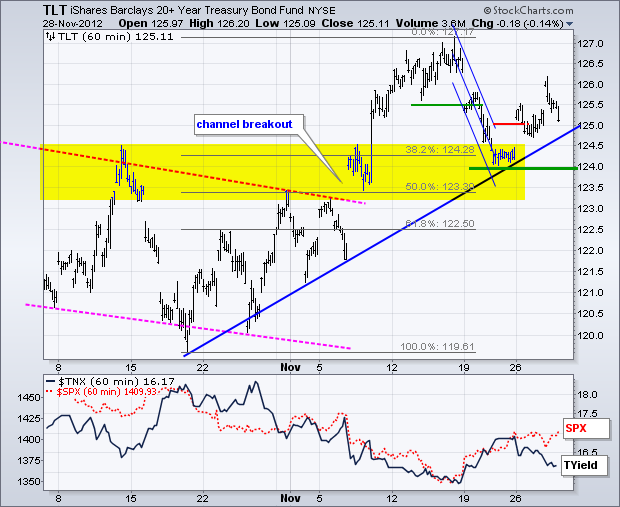
The 20+ Year T-Bond ETF (TLT) surged on the open as stocks moved lower. TLT soon peaked and moved lower as stocks rebounded from their weak open. The negative correlation between stocks and treasuries remains strong. The six week trend is up with key support set at 124. The four day trend is also up after Monday's breakout at 125. Something needs to give here. Because SPY and TLT are both up over the last four days.
**************************************************************************
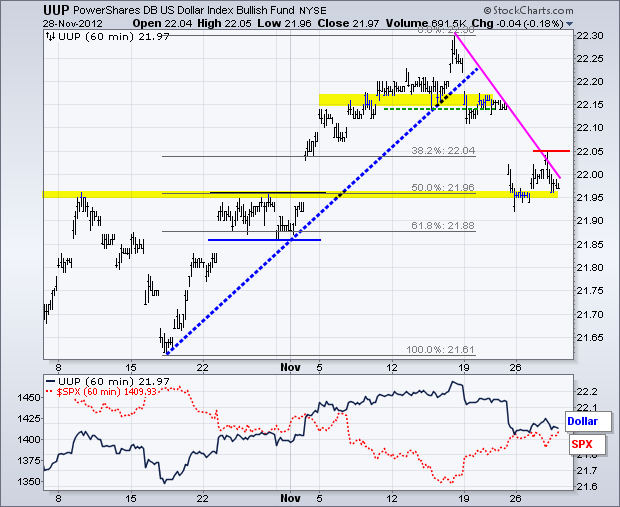
The US Dollar Fund (UUP) also surged on the open, but promptly retreated as stocks bounced off their opening lows. UUP remains in a downswing after the break below support in mid November. There is support in the 21.95 area from broken resistance and the 50% retracement. UUP reinforced resistance at 22.05 and needs to break this level to reverse the downswing.
**************************************************************************
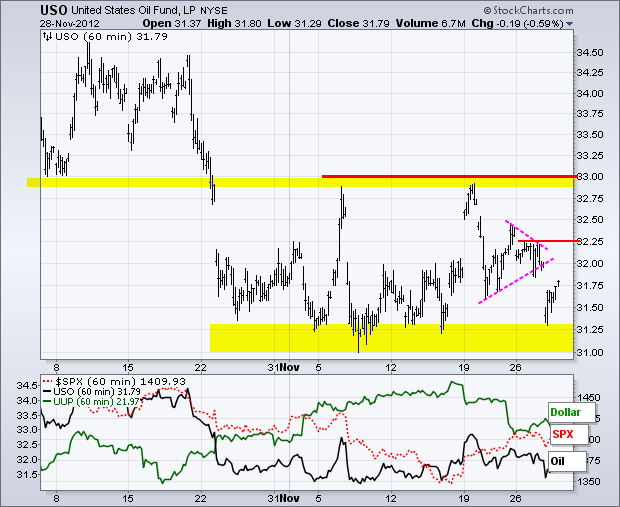
The US Oil Fund (USO) cannot hold a bid at all. Even though stocks closed up on the day, USO did not fill its opening gap and closed down. The triangle break is bearish within the larger consolidation. I can now mark first resistance at 32.25. Key resistance remains at 33.
**************************************************************************
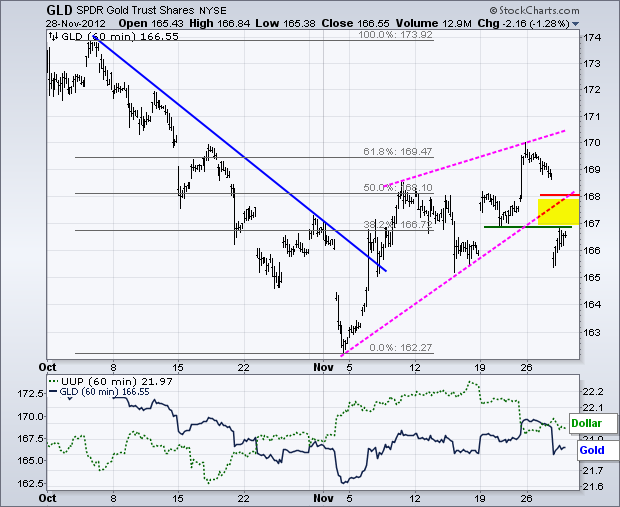
The Gold SPDR (GLD) took a big hit on Wednesday and broke support at 167. This decline was rather surprising because the Dollar remained subdued and stocks rebounded. GLD failed at the 61.80% retracement and broke wedge support to signal a continuation lower. Broken support turns first resistance at 168. A quick move above this level would negate the breakdown.
**************************************************************************
Key Reports and Events:
Thu - Nov 29 - 08:30 - Jobless Claims
Thu - Nov 29 - 08:30 - GDP
Thu - Nov 29 - 10:00 - Pending Home Sales
Fri - Nov 30 - 08:30 - Personal Income/Spending
Fri - Nov 30 - 09:45 - Chicago PMI
Charts of Interest: Tuesday and Thursday
This commentary and charts-of-interest are designed to stimulate thinking. This analysis is not a recommendation to buy, sell, hold or sell short any security (stock ETF or otherwise). We all need to think for ourselves when it comes to trading our own accounts. First, it is the only way to really learn. Second, we are the only ones responsible for our decisions. Think of these charts as food for further analysis. Before making a trade, it is important to have a plan. Plan the trade and trade the plan. Among other things, this includes setting a trigger level, a target area and a stop-loss level. It is also important to plan for three possible price movements: advance, decline or sideways. Have a plan for all three scenarios BEFORE making the trade. Consider possible holding times. And finally, look at overall market conditions and sector/industry performance.


**************************************************************************
The 20+ Year T-Bond ETF (TLT) surged on the open as stocks moved lower. TLT soon peaked and moved lower as stocks rebounded from their weak open. The negative correlation between stocks and treasuries remains strong. The six week trend is up with key support set at 124. The four day trend is also up after Monday's breakout at 125. Something needs to give here. Because SPY and TLT are both up over the last four days.

**************************************************************************
The US Dollar Fund (UUP) also surged on the open, but promptly retreated as stocks bounced off their opening lows. UUP remains in a downswing after the break below support in mid November. There is support in the 21.95 area from broken resistance and the 50% retracement. UUP reinforced resistance at 22.05 and needs to break this level to reverse the downswing.

**************************************************************************
The US Oil Fund (USO) cannot hold a bid at all. Even though stocks closed up on the day, USO did not fill its opening gap and closed down. The triangle break is bearish within the larger consolidation. I can now mark first resistance at 32.25. Key resistance remains at 33.

**************************************************************************
The Gold SPDR (GLD) took a big hit on Wednesday and broke support at 167. This decline was rather surprising because the Dollar remained subdued and stocks rebounded. GLD failed at the 61.80% retracement and broke wedge support to signal a continuation lower. Broken support turns first resistance at 168. A quick move above this level would negate the breakdown.

**************************************************************************
Key Reports and Events:
Thu - Nov 29 - 08:30 - Jobless Claims
Thu - Nov 29 - 08:30 - GDP
Thu - Nov 29 - 10:00 - Pending Home Sales
Fri - Nov 30 - 08:30 - Personal Income/Spending
Fri - Nov 30 - 09:45 - Chicago PMI
Charts of Interest: Tuesday and Thursday
This commentary and charts-of-interest are designed to stimulate thinking. This analysis is not a recommendation to buy, sell, hold or sell short any security (stock ETF or otherwise). We all need to think for ourselves when it comes to trading our own accounts. First, it is the only way to really learn. Second, we are the only ones responsible for our decisions. Think of these charts as food for further analysis. Before making a trade, it is important to have a plan. Plan the trade and trade the plan. Among other things, this includes setting a trigger level, a target area and a stop-loss level. It is also important to plan for three possible price movements: advance, decline or sideways. Have a plan for all three scenarios BEFORE making the trade. Consider possible holding times. And finally, look at overall market conditions and sector/industry performance.

About the author:
Arthur Hill, CMT, is the Chief Technical Strategist at TrendInvestorPro.com. Focusing predominantly on US equities and ETFs, his systematic approach of identifying trend, finding signals within the trend, and setting key price levels has made him an esteemed market technician. Arthur has written articles for numerous financial publications including Barrons and Stocks & Commodities Magazine. In addition to his Chartered Market Technician (CMT) designation, he holds an MBA from the Cass Business School at City University in London.
Learn More


