Ladies and gentlemen, the fiscal cliff is a farce built up by the media and the politicians. It is not a cliff, but rather a slope that can be remedied in January, February or even March. Of course, the longer the slope extends, the worse for the economy and the stock market. A few weeks of fiscal austerity will not make a difference. In other words, the deadline will pass and the issue will likely remain with us for several more weeks, if not months. Oh, perish the thought. Should Congress and the President come together for a patch before year-end, it will likely be a short-term fix that will not solve the bigger issues.
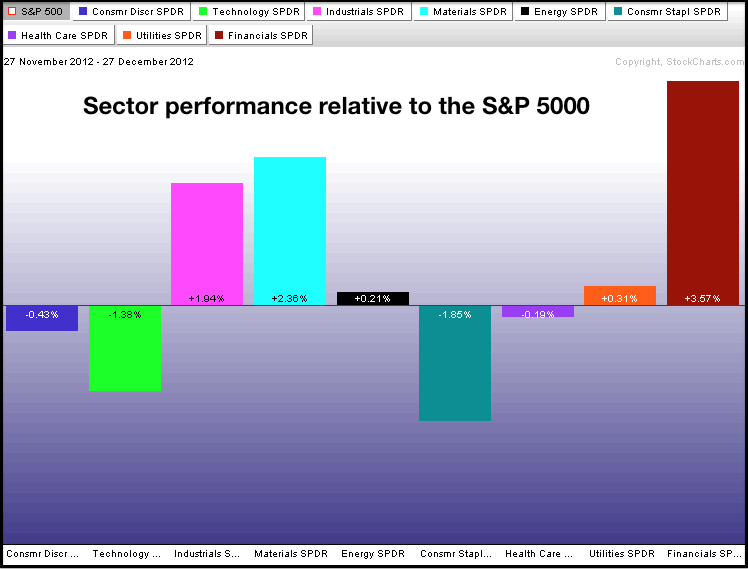
Even though I think the fiscal cliff hype is way overblown, that doesn't mean it will not affect the markets. The problem, however, is guessing correctly on the political maneuvering and then correctly predicting the market's reaction. Two successful predictions makes for one hard game. It is probably best to ignore the cliff and focus on the market (charts). Chartists should also allow for a little extra volatility or noise. I would not be surprised to see a choppy and directionless market for the next few weeks. Recent sector action reflects a divided market. The PerfChart below shows relative strength coming from the Industrials SPDR (XLI), the Basic Materials SPDR (XLB) and the Finance SPDR (XLF) over the past month. This is offset by relative weakness in the Consumer Discretionary SPDR (XLY), the Technology SPDR (XLK) and the Consumer Staples SPDR (XLP). I am particularly concerned with relative weakness in the consumer discretionary sector. No matter what happens with the cliff/slope, the finance sector is looking forward more quantitative easing in 2013.
Even though I think the fiscal cliff hype is way overblown, that doesn't mean it will not affect the markets. The problem, however, is guessing correctly on the political maneuvering and then correctly predicting the market's reaction. Two successful predictions makes for one hard game. It is probably best to ignore the cliff and focus on the market (charts). Chartists should also allow for a little extra volatility or noise. I would not be surprised to see a choppy and directionless market for the next few weeks. Recent sector action reflects a divided market. The PerfChart below shows relative strength coming from the Industrials SPDR (XLI), the Basic Materials SPDR (XLB) and the Finance SPDR (XLF) over the past month. This is offset by relative weakness in the Consumer Discretionary SPDR (XLY), the Technology SPDR (XLK) and the Consumer Staples SPDR (XLP). I am particularly concerned with relative weakness in the consumer discretionary sector. No matter what happens with the cliff/slope, the finance sector is looking forward more quantitative easing in 2013.

**************************************************************************
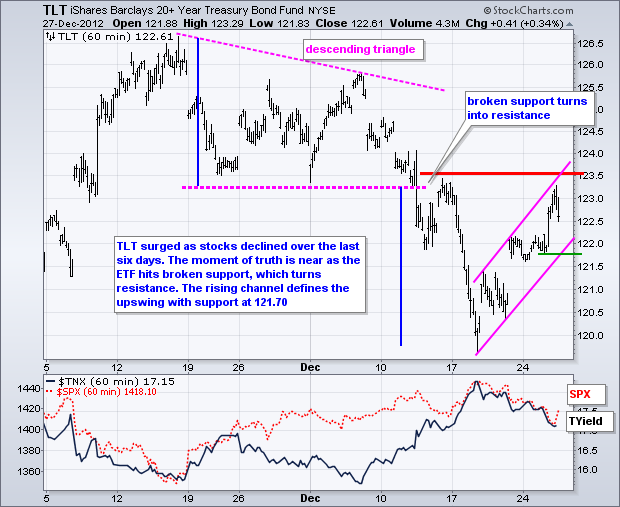
**************************************************************************
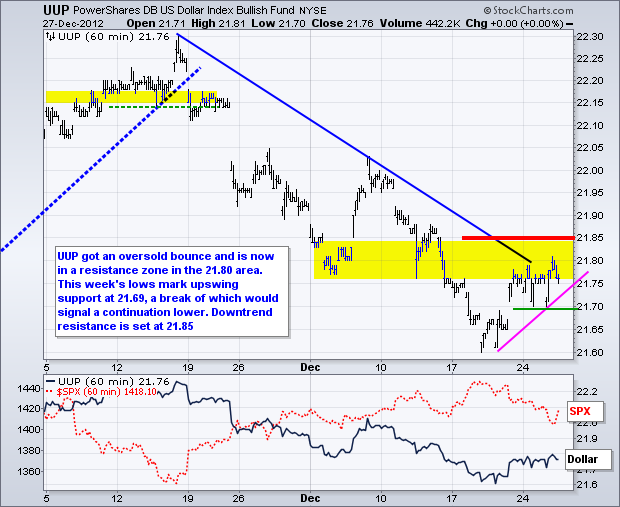
**************************************************************************
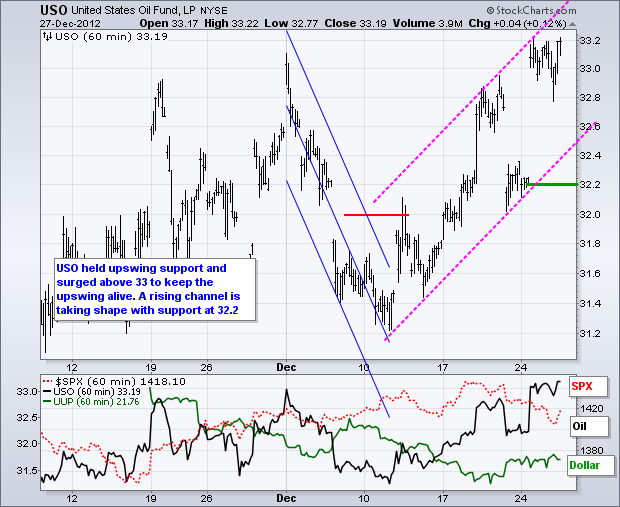
**************************************************************************
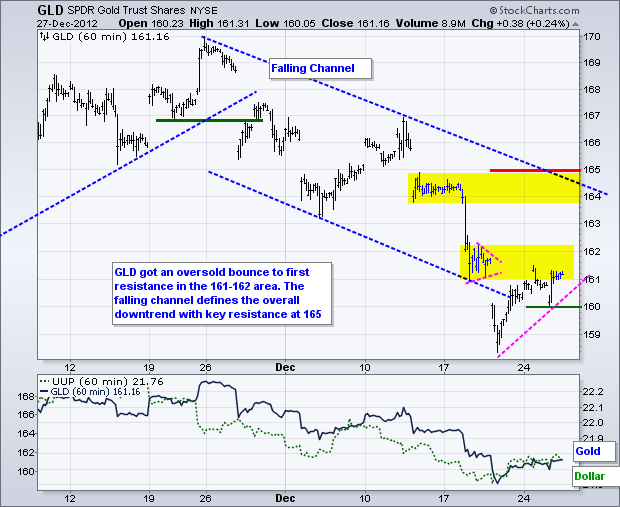
**************************************************************************
Key Reports and Events:
Fri - Dec 28 - 09:45 - Chicago PMI
Fri - Dec 28 - 10:00 - Pending Home Sales
Fri - Dec 28 - 11:00 - Oil Inventories
Charts of Interest: Tuesday and Thursday
This commentary and charts-of-interest are designed to stimulate thinking. This analysis is not a recommendation to buy, sell, hold or sell short any security (stock ETF or otherwise). We all need to think for ourselves when it comes to trading our own accounts. First, it is the only way to really learn. Second, we are the only ones responsible for our decisions. Think of these charts as food for further analysis. Before making a trade, it is important to have a plan. Plan the trade and trade the plan. Among other things, this includes setting a trigger level, a target area and a stop-loss level. It is also important to plan for three possible price movements: advance, decline or sideways. Have a plan for all three scenarios BEFORE making the trade. Consider possible holding times. And finally, look at overall market conditions and sector/industry performance.

About the author:
Arthur Hill, CMT, is the Chief Technical Strategist at TrendInvestorPro.com. Focusing predominantly on US equities and ETFs, his systematic approach of identifying trend, finding signals within the trend, and setting key price levels has made him an esteemed market technician. Arthur has written articles for numerous financial publications including Barrons and Stocks & Commodities Magazine. In addition to his Chartered Market Technician (CMT) designation, he holds an MBA from the Cass Business School at City University in London.
Learn More


