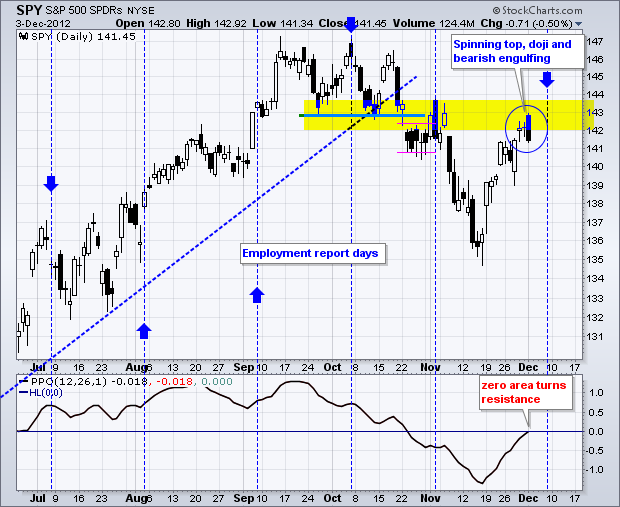
It was drop and pop last Wednesday as stocks opened weak and then rallied. Monday was different as stocks opened strong and then sold off. The S&P 500 was up just over 1/2% in early trading, but fell after the ISM Manufacturing Index was reported. ISM fell to 49.5, which was well below expectations and below 50 for the first time since July 2009. Manufacturing is, of course, only part of the economic equation. We will know the rest of the story when the ISM Services Index is reported on Wednesday. The chart below shows SPY forming a spinning top on Thursday, a doji on Friday and a bearish engulfing on Monday. The first two candlesticks show indecision after a gap. Monday's engulfing reflects an intraday reversal that affirms resistance in the 142-143 area.

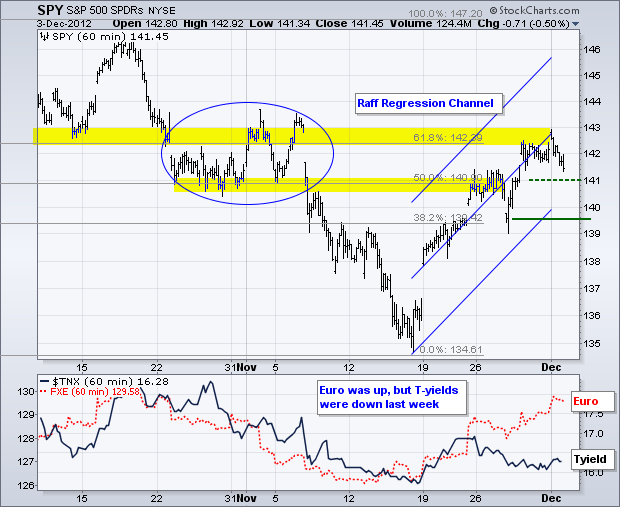
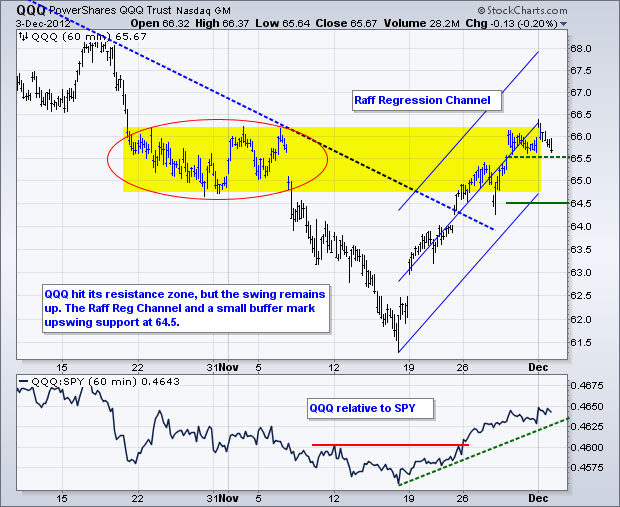
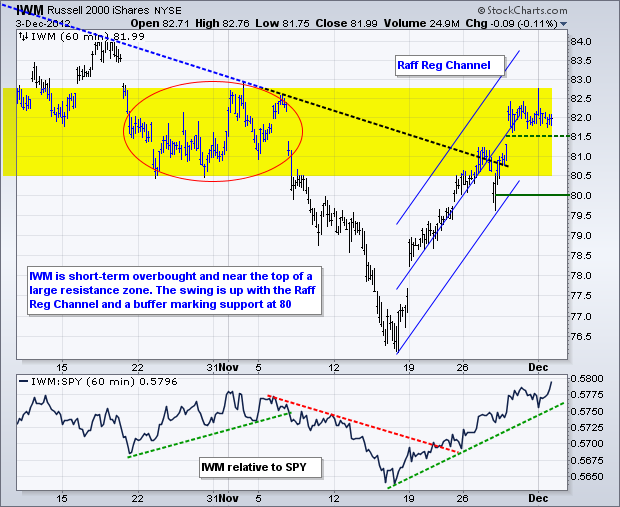
On the 60-minute chart, SPY closed above 142.5 in the first hour and I extended the Raff Regression Channel to this new closing high. The lower trend line ends around 140 and I am adding a .50 point buffer to mark support at 139.50. A move below this level would clearly break the rising channel and signal a short-term trend reversal. Further up, I am marking minor support at 141 and a break below this level would provide the early signal that prices were rolling over. Note that the chances of increased volatility appear to be above average as we head into the employment report on Friday and fiscal cliff jawboning continues.
**************************************************************************
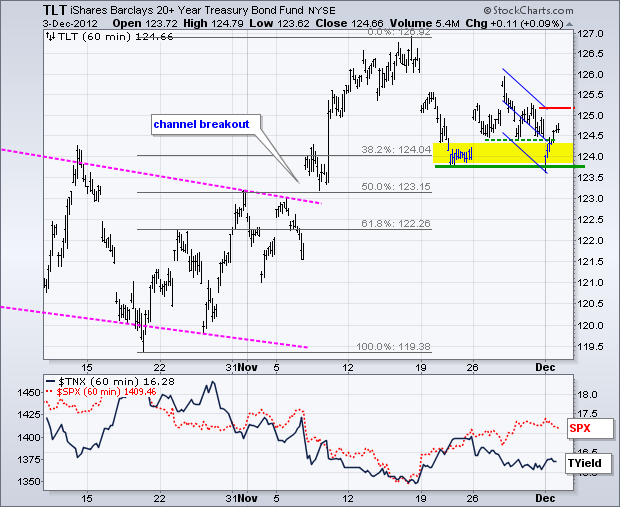
The 20+ Year T-Bond ETF (TLT) opened weak with a move below 124, but quickly rebounded and closed near its high for the day. Note that TLT data was adjusted for a dividend and this shifted support. The bigger trend is up after a channel breakout in early November. After a pullback to the breakout, trading has turned choppy the last six days. A smaller falling channel has taken shape the last few days and a move above 125.2 would break channel resistance.
**************************************************************************
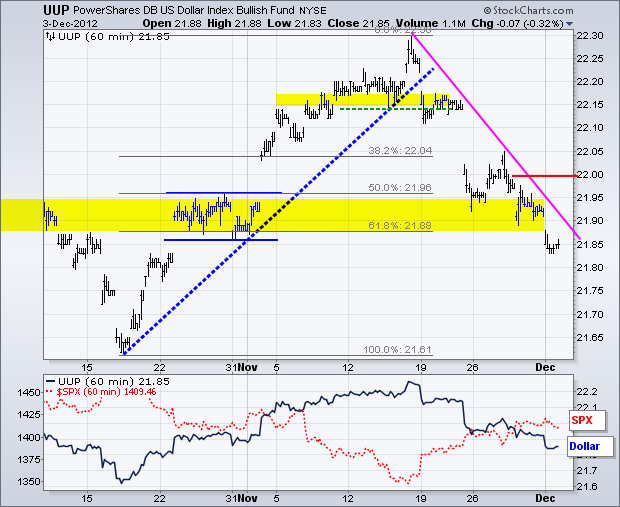
The US Dollar Fund (UUP) seems to reflect the fiscal cliff realities more than the stock market. We have heard a lot of talk as both sides jockey for the upper hand in the negotiations, but the position differences remain large. It is a game of chicken and neither side will give in until the very last minute. UUP opened weak and remained weak. The downtrend continues with key resistance now marked at 22.
**************************************************************************
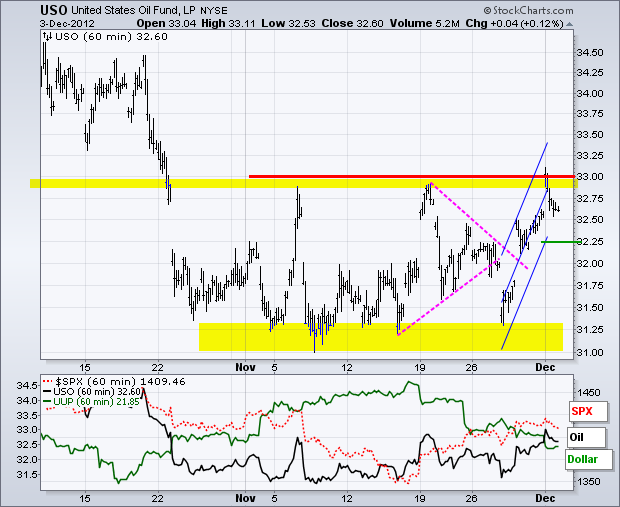
The US Oil Fund (USO) surged to resistance, but fell back with the stock market and once again failed to break out. The swing within the trading range is up with the Raff Regression Channel marking support at 32.25. A break below this level would reverse the upswing and argue for a support test in the 31-31.25 area. A break below 31 would signal a continuation of the bigger downtrend.
**************************************************************************
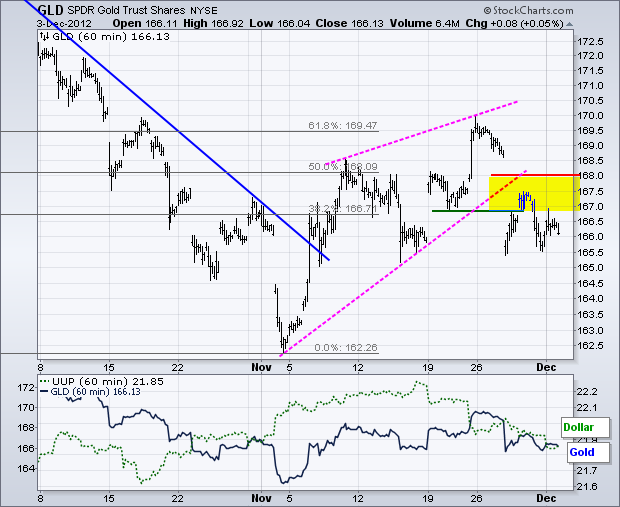
No change. Even though the Dollar extended its downtrend and the stock market continued its uptrend last week, the Gold SPDR (GLD) broke down with a sharp decline below 167. This move broke rising wedge support to signal a continuation of the October decline. Overall, GLD has been in a trading range since October 2011 (148 – 175). Broken support turns resistance in the 167-168 area.
**************************************************************************
Key Reports and Events:
Wed - Dec 05 - 07:00 - MBA Mortgage Index
Wed - Dec 05 - 08:15 - ADP Employment Report
Wed - Dec 05 - 10:00 - Factory Orders
Wed - Dec 05 - 10:00 - ISM Services Index
Wed - Dec 05 - 10:30 - Oil Inventories
Thu - Dec 06 - 07:30 - Challenger Job Cuts
Thu - Dec 06 - 08:30 - Jobless Claims
Fri - Dec 07 - 08:30 - Employment Report
Fri - Dec 07 - 09:55 - Michigan Sentiment
Charts of Interest: Tuesday and Thursday
This commentary and charts-of-interest are designed to stimulate thinking. This analysis is not a recommendation to buy, sell, hold or sell short any security (stock ETF or otherwise). We all need to think for ourselves when it comes to trading our own accounts. First, it is the only way to really learn. Second, we are the only ones responsible for our decisions. Think of these charts as food for further analysis. Before making a trade, it is important to have a plan. Plan the trade and trade the plan. Among other things, this includes setting a trigger level, a target area and a stop-loss level. It is also important to plan for three possible price movements: advance, decline or sideways. Have a plan for all three scenarios BEFORE making the trade. Consider possible holding times. And finally, look at overall market conditions and sector/industry performance.


**************************************************************************
The 20+ Year T-Bond ETF (TLT) opened weak with a move below 124, but quickly rebounded and closed near its high for the day. Note that TLT data was adjusted for a dividend and this shifted support. The bigger trend is up after a channel breakout in early November. After a pullback to the breakout, trading has turned choppy the last six days. A smaller falling channel has taken shape the last few days and a move above 125.2 would break channel resistance.

**************************************************************************
The US Dollar Fund (UUP) seems to reflect the fiscal cliff realities more than the stock market. We have heard a lot of talk as both sides jockey for the upper hand in the negotiations, but the position differences remain large. It is a game of chicken and neither side will give in until the very last minute. UUP opened weak and remained weak. The downtrend continues with key resistance now marked at 22.

**************************************************************************
The US Oil Fund (USO) surged to resistance, but fell back with the stock market and once again failed to break out. The swing within the trading range is up with the Raff Regression Channel marking support at 32.25. A break below this level would reverse the upswing and argue for a support test in the 31-31.25 area. A break below 31 would signal a continuation of the bigger downtrend.

**************************************************************************
No change. Even though the Dollar extended its downtrend and the stock market continued its uptrend last week, the Gold SPDR (GLD) broke down with a sharp decline below 167. This move broke rising wedge support to signal a continuation of the October decline. Overall, GLD has been in a trading range since October 2011 (148 – 175). Broken support turns resistance in the 167-168 area.

**************************************************************************
Key Reports and Events:
Wed - Dec 05 - 07:00 - MBA Mortgage Index
Wed - Dec 05 - 08:15 - ADP Employment Report
Wed - Dec 05 - 10:00 - Factory Orders
Wed - Dec 05 - 10:00 - ISM Services Index
Wed - Dec 05 - 10:30 - Oil Inventories
Thu - Dec 06 - 07:30 - Challenger Job Cuts
Thu - Dec 06 - 08:30 - Jobless Claims
Fri - Dec 07 - 08:30 - Employment Report
Fri - Dec 07 - 09:55 - Michigan Sentiment
Charts of Interest: Tuesday and Thursday
This commentary and charts-of-interest are designed to stimulate thinking. This analysis is not a recommendation to buy, sell, hold or sell short any security (stock ETF or otherwise). We all need to think for ourselves when it comes to trading our own accounts. First, it is the only way to really learn. Second, we are the only ones responsible for our decisions. Think of these charts as food for further analysis. Before making a trade, it is important to have a plan. Plan the trade and trade the plan. Among other things, this includes setting a trigger level, a target area and a stop-loss level. It is also important to plan for three possible price movements: advance, decline or sideways. Have a plan for all three scenarios BEFORE making the trade. Consider possible holding times. And finally, look at overall market conditions and sector/industry performance.

About the author:
Arthur Hill, CMT, is the Chief Technical Strategist at TrendInvestorPro.com. Focusing predominantly on US equities and ETFs, his systematic approach of identifying trend, finding signals within the trend, and setting key price levels has made him an esteemed market technician. Arthur has written articles for numerous financial publications including Barrons and Stocks & Commodities Magazine. In addition to his Chartered Market Technician (CMT) designation, he holds an MBA from the Cass Business School at City University in London.
Learn More


