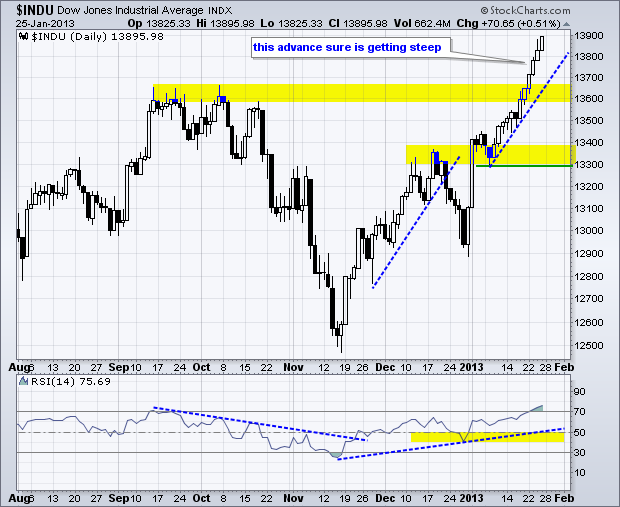
What more could a stock market want? The S&P 500 advanced the last eight days in a row and closed at a 52-week high. The Dow surged some 400 points in the last six days. Treasury bonds fell as market participants moved from safe-havens to riskier assets. The Euro surged after the European Central Bank (ECB) reported positive results on LTRO paybacks by big EU banks. This means the Dollar fell, which suggests the markets are in risk-on mode. Oil remains in an uptrend as Spot Light Crude ($WTIC) closed above $96. Even Apple failed to weigh on the broader market last week, though it did weigh on QQQ and the Technology SPDR. Stocks remain short-term overbought, but buyers are simply not pulling in their horns. More importantly, selling pressure is virtually absent. I get the feeling that money managers are scrambling to put stocks on the book and not miss out on this great start. There is no sense fighting the tape or the Fed. However, chasing the tape could be dangerous as stocks become quite overextended and ripe for a corrective period. Also note that it is a HUGE week for economic reports, the Fed meets on Wednesday and earnings season is in full swing.
**************************************************************************
**************************************************************************
**************************************************************************
**************************************************************************
**************************************************************************
Key Reports and Events:
Mon - Jan 28 - 08:30 - Durable Orders
Mon - Jan 28 - 10:00 - Pending Home Sales
Tue - Jan 29 - 09:00 - Case-Shiller Housing Index
Tue - Jan 29 - 10:00 - Consumer Confidence
Wed - Jan 30 - 07:00 - MBA Mortgage Index
Wed - Jan 30 - 08:15 - ADP Employment Report
Wed - Jan 30 - 08:30 - GDP
Wed - Jan 30 - 10:30 - Oil Inventories
Wed - Jan 30 - 14:15 - FOMC Policy Statement
Thu - Jan 31 - 07:30 - Challenger Job Cuts
Thu - Jan 31 - 08:30 - Jobless Claims
Thu - Jan 31 - 08:30 - Personal Income & Spending
Thu - Jan 31 - 09:45 - Chicago PMI
Thu - Jan 31 - 10:30 - Natural Gas Inventories
Fri - Feb 01 - 08:30 – Employment Report
Fri - Feb 01 - 09:55 - Michigan Sentiment
Fri - Feb 01 - 10:00 - ISM Index
Fri - Feb 01 - 10:00 - Construction Spending
Fri - Feb 01 - 14:00 - Auto/Sales
Fri – Mar 01 - 23:59 – Sequester Takes Effect
Wed – Mar 27 - 23:59 – Government Shut Down Deadline
Wed – May 15 - 23:59 – New Debt Ceiling Deadline
Charts of Interest: Tuesday and Thursday
This commentary and charts-of-interest are designed to stimulate thinking. This analysis is
not a recommendation to buy, sell, hold or sell short any security (stock ETF or otherwise).
We all need to think for ourselves when it comes to trading our own accounts. First, it is
the only way to really learn. Second, we are the only ones responsible for our decisions.
Think of these charts as food for further analysis. Before making a trade, it is important
to have a plan. Plan the trade and trade the plan. Among other things, this includes setting
a trigger level, a target area and a stop-loss level. It is also important to plan for three
possible price movements: advance, decline or sideways. Have a plan for all three scenarios
BEFORE making the trade. Consider possible holding times. And finally, look at overall market
conditions and sector/industry performance.


