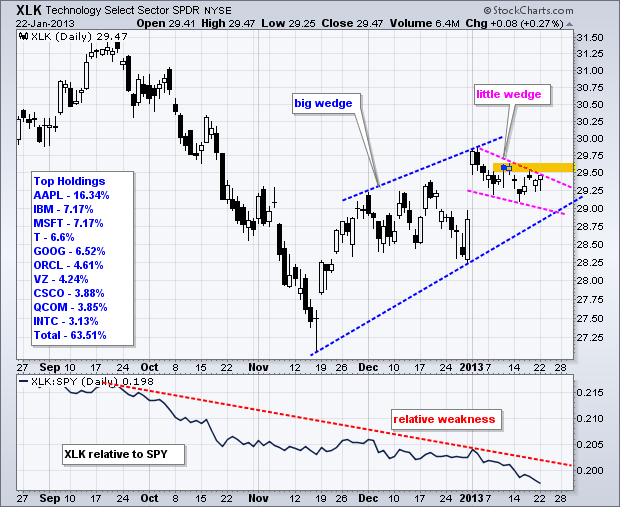
Stocks extended their gains on Tuesday with the Russell 2000 ETF (IWM) and S&P MidCap 400 SPDR (MDY) leading the way higher. Small-caps and mid-caps have been leading this market since mid November and show no signs of slowing down. Finance, materials, energy and utilities led the sectors higher. The consumer discretionary and technology sectors lagged. Even so, the Nasdaq 100 Equal-Weight ETF (QQEW) recorded a new high. It is make or break time for the Nasdaq 100 ETF (QQQ) and Technology SPDR (XLK) as these large-cap dominated ETFs form consolidation patterns this month. QQQ has a flat consolidation working, while XLK formed a falling wedge. A break above the mid January highs would signal a continuation higher and put big techs back on the bullish track. Google did its part with a earnings beat and surge to 738 after hours.


**************************************************************************

**************************************************************************
**************************************************************************
**************************************************************************
**************************************************************************
Key Reports and Events:
Wed - Jan 23 - 07:00 - MBA Mortgage Index
Thu - Jan 24 - 08:30 - Jobless Claims
Thu - Jan 24 - 10:00 - Leading Indicators
Thu - Jan 24 - 10:30 - Natural Gas Inventories
Thu - Jan 24 - 11:00 - Oil Inventories
Fri - Jan 25 - 10:00 - New Home Sales
Fri – Mar 01 - 23:59 – Sequester Takes Effect
Wed – Mar 27 - 23:59 – Government Shut Down Deadline
Sun – Mar 31 - 23:59 – Debt Ceiling Deadline
Charts of Interest: Tuesday and Thursday
This commentary and charts-of-interest are designed to stimulate thinking. This analysis is
not a recommendation to buy, sell, hold or sell short any security (stock ETF or otherwise).
We all need to think for ourselves when it comes to trading our own accounts. First, it is
the only way to really learn. Second, we are the only ones responsible for our decisions.
Think of these charts as food for further analysis. Before making a trade, it is important
to have a plan. Plan the trade and trade the plan. Among other things, this includes setting
a trigger level, a target area and a stop-loss level. It is also important to plan for three
possible price movements: advance, decline or sideways. Have a plan for all three scenarios
BEFORE making the trade. Consider possible holding times. And finally, look at overall market
conditions and sector/industry performance.


