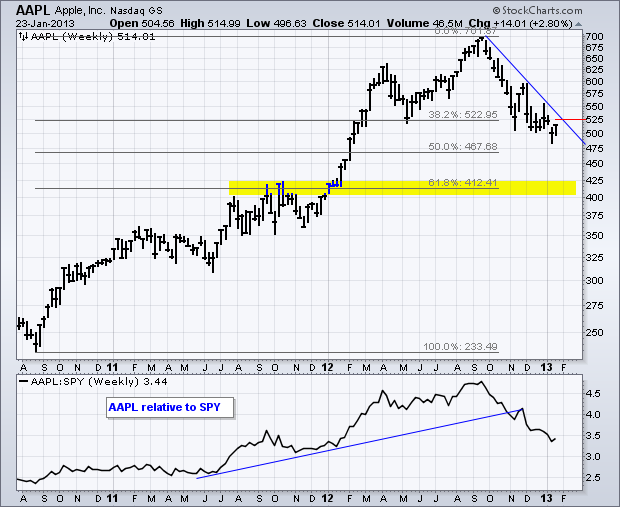
Apple whiffed and the stock is trading sharply lower after hours. This means the Nasdaq, QQQ and the Technology SPDR (XLK) will also be down in early trading on Thursday. It seems to be an Apple and big tech specific issue because the Dow futures are up slightly and the S&P 500 futures are down just 3 points. Broadcom, Skyworks and Qualcom were also lower. How low can Apple go? I put for a chart in the market message on January 14th that showed a bearish descending triangle taking shape. The stock confirmed this pattern with a break below 500 the very next day, but moved right back above this key level. Apple is again trading well below 500 after hours and the next support zone resides in the 400-425 area. Support here stems from broken resistance (2011 highs) and the 61.80% retracement line. Elsewhere, earnings on the whole are positive. Google and IBM reacted well to their earnings and this cancels out the Apple miss. Despite this positive environment, stocks remain overbought after big runs since 31-December. I am also a bit concerned with continued strength in the 20+ Year T-Bond ETF (TLT). Treasuries should be moving lower when stocks are moving higher. Continued strength in TLT could haunt the bulls in the stock market.


**************************************************************************

**************************************************************************

**************************************************************************

**************************************************************************

**************************************************************************
Key Reports and Events:
Thu - Jan 24 - 08:30 - Jobless Claims
Thu - Jan 24 - 10:00 - Leading Indicators
Thu - Jan 24 - 10:30 - Natural Gas Inventories
Thu - Jan 24 - 11:00 - Oil Inventories
Fri - Jan 25 - 10:00 - New Home Sales
Fri – Mar 01 - 23:59 – Sequester Takes Effect
Wed – Mar 27 - 23:59 – Government Shut Down Deadline
Wed – May 15 - 23:59 – New Debt Ceiling Deadline
Charts of Interest: Tuesday and Thursday
This commentary and charts-of-interest are designed to stimulate thinking. This analysis is
not a recommendation to buy, sell, hold or sell short any security (stock ETF or otherwise).
We all need to think for ourselves when it comes to trading our own accounts. First, it is
the only way to really learn. Second, we are the only ones responsible for our decisions.
Think of these charts as food for further analysis. Before making a trade, it is important
to have a plan. Plan the trade and trade the plan. Among other things, this includes setting
a trigger level, a target area and a stop-loss level. It is also important to plan for three
possible price movements: advance, decline or sideways. Have a plan for all three scenarios
BEFORE making the trade. Consider possible holding times. And finally, look at overall market
conditions and sector/industry performance.

About the author:
Arthur Hill, CMT, is the Chief Technical Strategist at TrendInvestorPro.com. Focusing predominantly on US equities and ETFs, his systematic approach of identifying trend, finding signals within the trend, and setting key price levels has made him an esteemed market technician. Arthur has written articles for numerous financial publications including Barrons and Stocks & Commodities Magazine. In addition to his Chartered Market Technician (CMT) designation, he holds an MBA from the Cass Business School at City University in London.
Learn More


