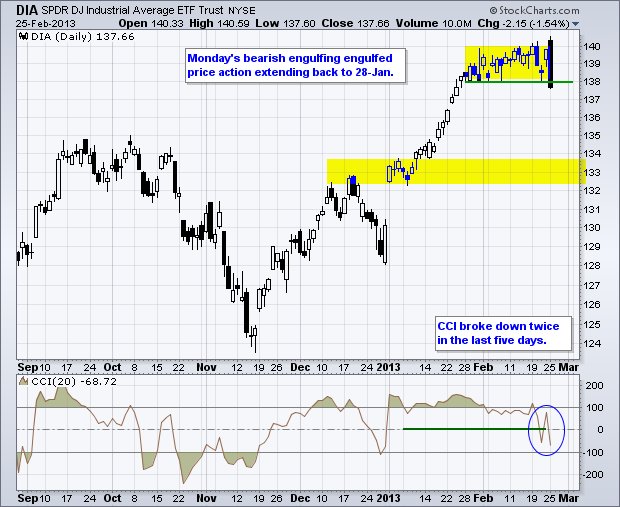
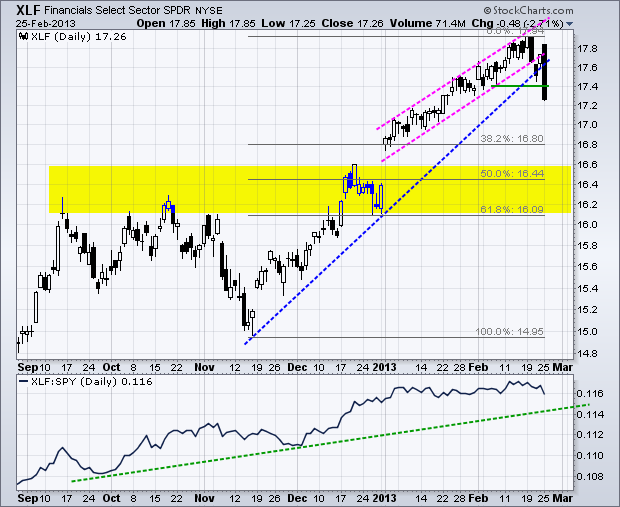
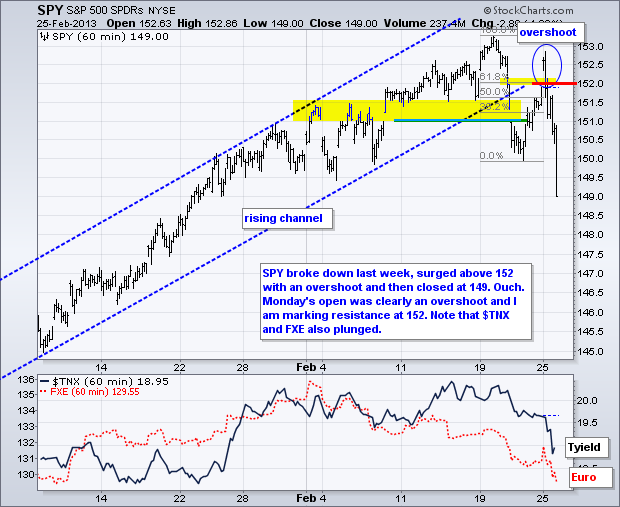
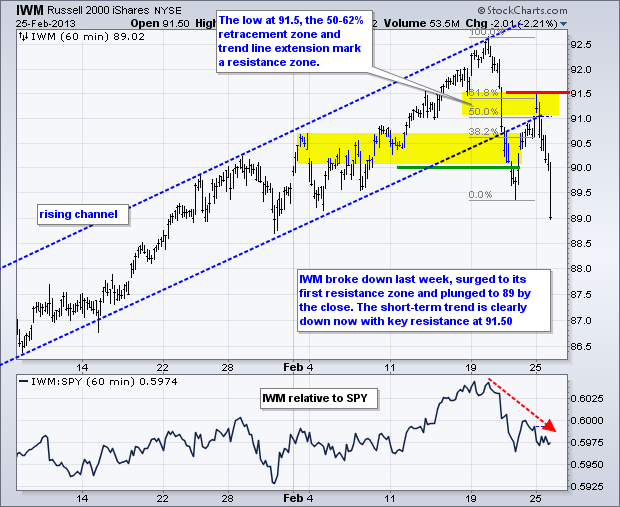
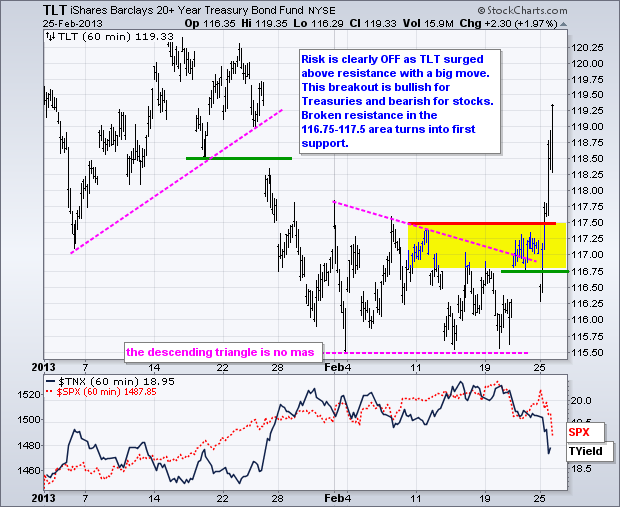
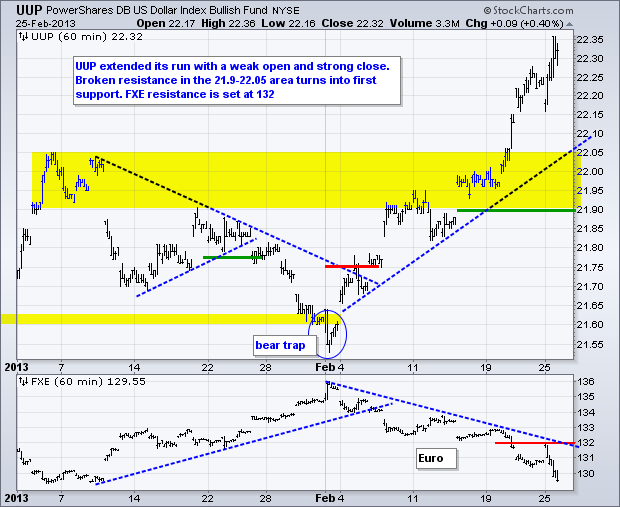
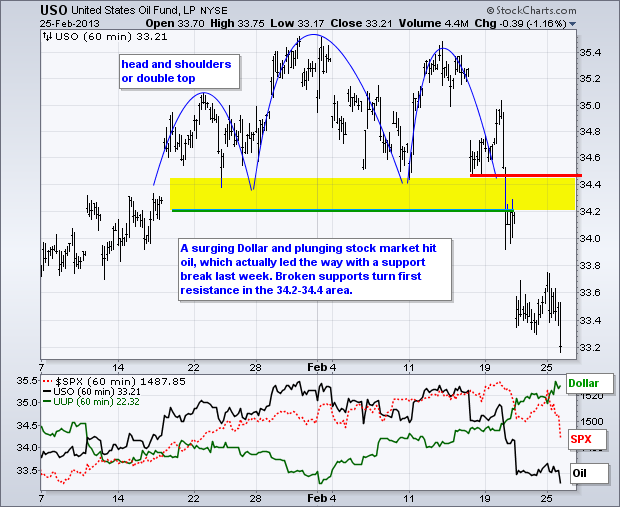
Stocks surged on the open, quickly weakened and then plunged in the final hour. We all know where the blame went. Even though the Italian elections took the rap, note that the Euro has been falling since 4-Feb and Italian stocks are down around 10% over the past month. US stocks were overbought and hit by a perfect storm. I would suggest that the real concerns are closer to home. The combination of sequester fears, payroll tax concerns and quantitative easing issues prompted some profit taking that got out of hand with last weeks Fed minutes and the Italian election results. The Dow SPDR (DIA) formed a bearish engulfing that engulfed the last four weeks of trading. How's that for an outside reversal. XLF also formed a large reversal as it opened above 17.80 and closed below support at 17.40. XLF led the market from mid November to mid February. It is clear from Monday's price action that big banks are the most vulnerable to contagion from troubles in Europe. While I am not predicting serious trouble, note that XLF was up considerably without a correction and could realistically retrace around 50% of the prior advance.
**************************************************************************
**************************************************************************
**************************************************************************
**************************************************************************
**************************************************************************
Key Reports and Events (all times Eastern):
Mon - Feb 25 - 09:00 – Italian Polls Close
Tue - Feb 26 - 09:00 - Case-Shiller 20-city Index
Tue - Feb 26 - 09:00 - FHFA Housing Price Index
Tue - Feb 26 - 10:00 - New Home Sales
Tue - Feb 26 - 10:00 - Consumer Confidence
Tue - Feb 26 - 10:00 - Bernanke testifies before Congress
Wed - Feb 27 - 07:00 - MBA Mortgage Index
Wed - Feb 27 - 08:30 - Durable Goods Orders
Wed - Feb 27 - 10:00 - Pending Home Sales
Wed - Feb 27 - 10:00 - Bernanke testifies before Congress
Wed - Feb 27 - 10:30 - Oil Inventories
Thu - Feb 28 - 08:30 - Jobless Claims
Thu - Feb 28 - 08:30 - GDP
Thu - Feb 28 - 09:45 - Chicago PMI
Thu - Feb 28 - 10:30 - Natural Gas Inventories
Fri - Mar 01 - 08:30 - Personal Income & Spending
Fri - Mar 01 - 09:55 - Michigan Sentiment
Fri - Mar 01 - 10:00 - ISM Index
Fri - Mar 01 - 10:00 - Construction Spending
Fri - Mar 01 - 14:00 - Auto Sales/Truck Sales
Fri – Mar 01 - 23:59 – Sequester Takes Effect (unless...)
Wed – Mar 27 - 23:59 – Government Shut Down Deadline
Wed – May 15 - 23:59 – New Debt Ceiling Deadline
Charts of Interest: Tuesday and Thursday
This commentary and charts-of-interest are designed to stimulate thinking. This analysis is
not a recommendation to buy, sell, hold or sell short any security (stock ETF or otherwise).
We all need to think for ourselves when it comes to trading our own accounts. First, it is
the only way to really learn. Second, we are the only ones responsible for our decisions.
Think of these charts as food for further analysis. Before making a trade, it is important
to have a plan. Plan the trade and trade the plan. Among other things, this includes setting
a trigger level, a target area and a stop-loss level. It is also important to plan for three
possible price movements: advance, decline or sideways. Have a plan for all three scenarios
BEFORE making the trade. Consider possible holding times. And finally, look at overall market
conditions and sector/industry performance.

