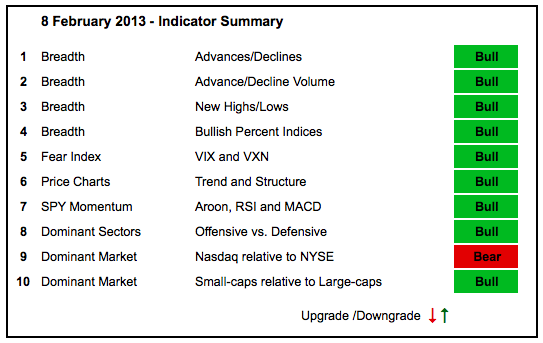
There is no change in the indicator summary because the market did not move much this week. Stocks have been in a stalling pattern the last two weeks. The medium-term and long-term trends are clearly up, but this stall could signal the start of a corrective period that could last a few more weeks. The AD Lines and AD Volume Lines are also overextended. The Bullish Percent Indices are all well above 50%, but the S&P 100 BPI ($BPOEX) turned down the last two weeks and moved below 80%. After becoming overbought in late January, this small decline shows some corrective forces at work.
- AD Lines: Bullish. The Nasdaq AD Line broke the mid December high and April trend line to turn bullish in early January. The NYSE AD Line hit a new high in early February and remains in a strong uptrend.
- AD Volume Lines: Bullish. The Nasdaq AD Volume Line broke above its September high in early January and is nearing its March 2012 high. The NYSE AD Volume Line moved to a new high in early February and remains in a strong uptrend.
- Net New Highs: Bullish. Net New Highs fell from their recent high levels, but remain positive and the cumulative lines recorded new highs.
- Bullish Percent Indices: Bullish. All nine sector Bullish Percent Indices are above 50%.
- VIX/VXN: Bullish. The S&P 500 Volatility Index ($VIX) and the Nasdaq 100 Volatility Index ($VXN) are below 15% and in downtrends.
- Trend-Structure: Bullish. IWM, SPY, MDY, QQEW and DIA hit new 52-week highs over the last two weeks and remain in uptrends. They are, however, overbought and ripe for a correction.
- SPY Momentum: Bullish. RSI fell back below 70, which may suggest that a corrective period is nearing. MACD(5,35,5) also moved below its signal line. Aroon remains well above 50 and has been positive since the first week of December.
- Offensive Sector Performance: Bullish. The offensive sectors (sans XLK) are outperforming on the one and three month timeframes. Note that the Nasdaq 100 Equal-Weight ETF (QQEW) is also outperforming on these timeframes.
- Nasdaq Performance: Bearish. The $COMPQ:$NYA ratio has been trending lower since early September and hit a 52-week low in late January.
- Small-cap Performance: Bullish. The $RUT:$OEX ratio has been on a tear since mid November as small-caps outpace large-caps. This ratio, however, may be getting overextended.
- Breadth Charts (here) and Inter-market charts (here) have been updated.

About the author:
Arthur Hill, CMT, is the Chief Technical Strategist at TrendInvestorPro.com. Focusing predominantly on US equities and ETFs, his systematic approach of identifying trend, finding signals within the trend, and setting key price levels has made him an esteemed market technician. Arthur has written articles for numerous financial publications including Barrons and Stocks & Commodities Magazine. In addition to his Chartered Market Technician (CMT) designation, he holds an MBA from the Cass Business School at City University in London.
Learn More


