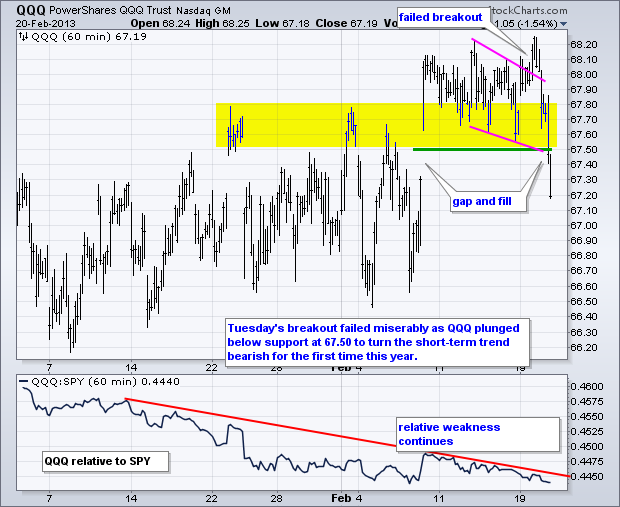
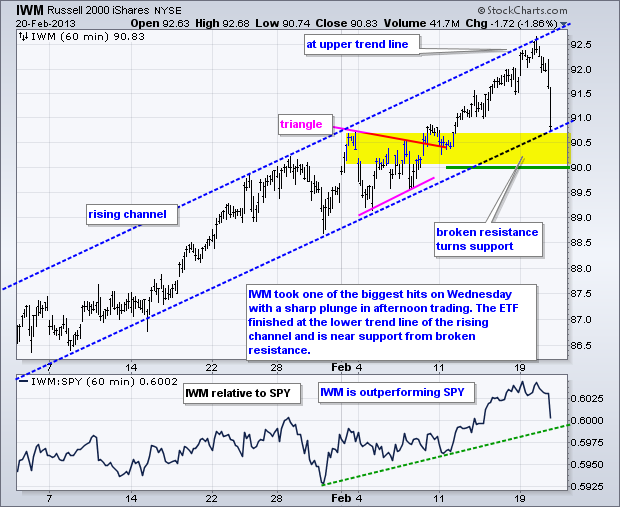
Stocks were weak in early trading and then got slammed in the afternoon. In addition to overbought conditions, several factors contributed to the afternoon sell off. Industrial metals fell sharply over the last few days due to concerns with Chinese economic growth. Several industry group ETFs within the materials sector broke down on Wednesday (XME, SLX, COPX). It may continue because the Shanghai Composite ($SSEC) is down around 3% today and down for the month of February.
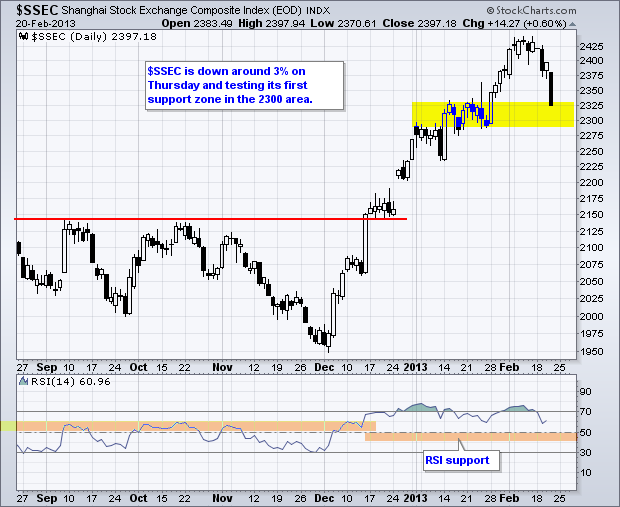

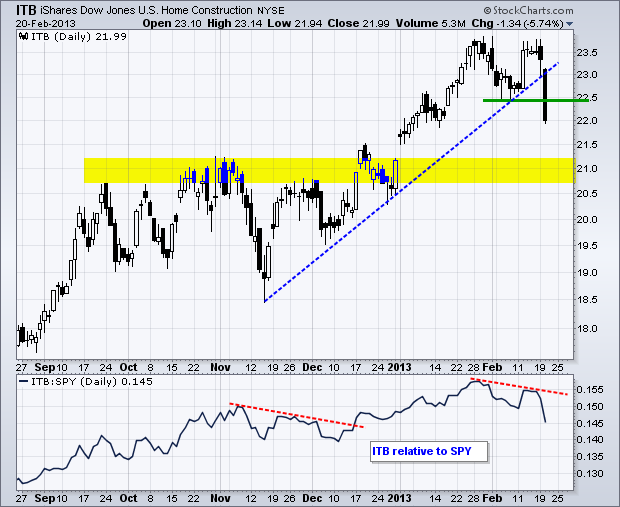
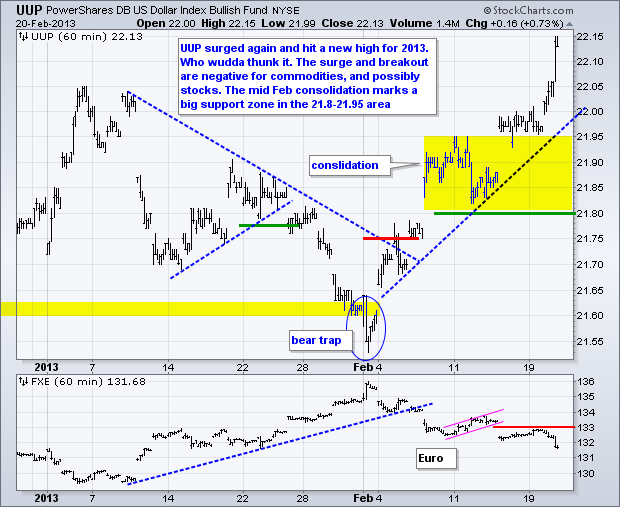
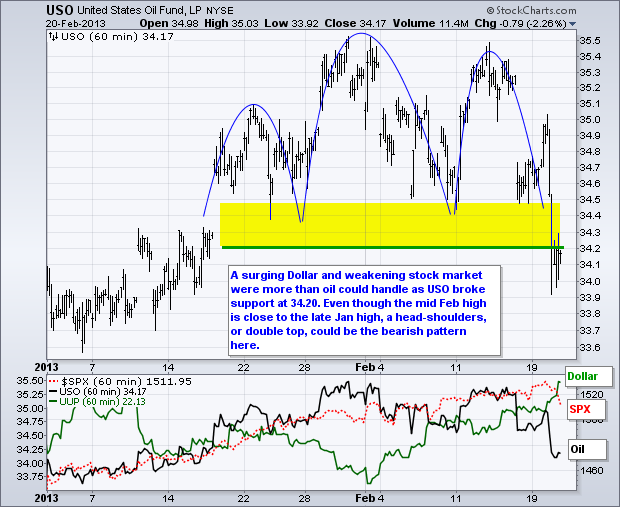
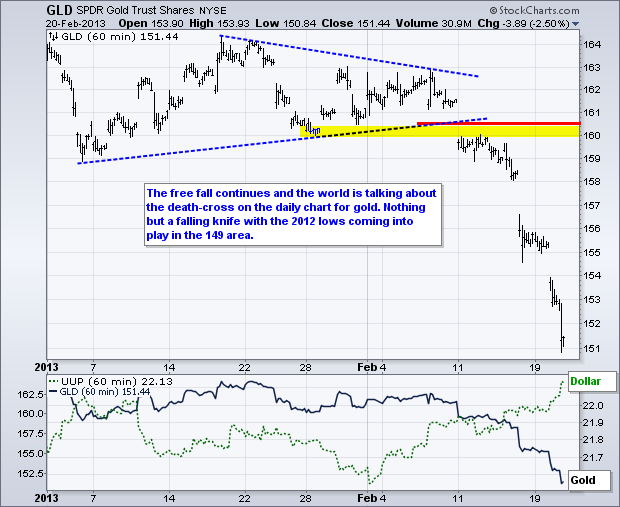
Commodities were also hit by a surging Dollar in February, which could also be negative for stocks because the Euro is plunging. Closer to home, housing starts disappointed in January and housing stocks were taken out to the shed for a beating. The Home Construction iShares (ITB) fell over 5% and broke below its early February low. ITB is now showing relative weakness in 2013.
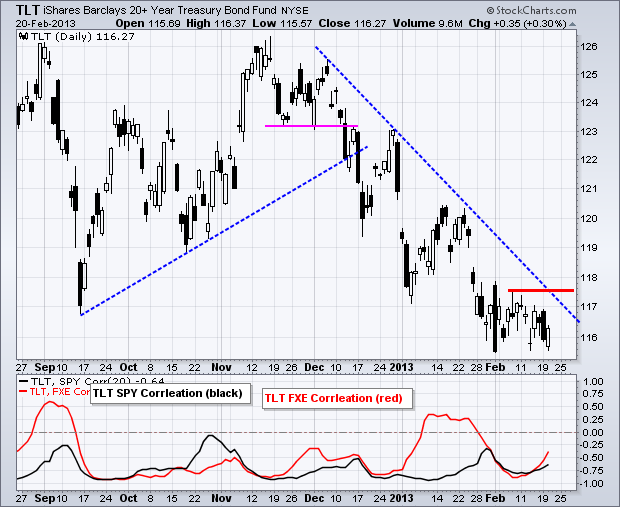
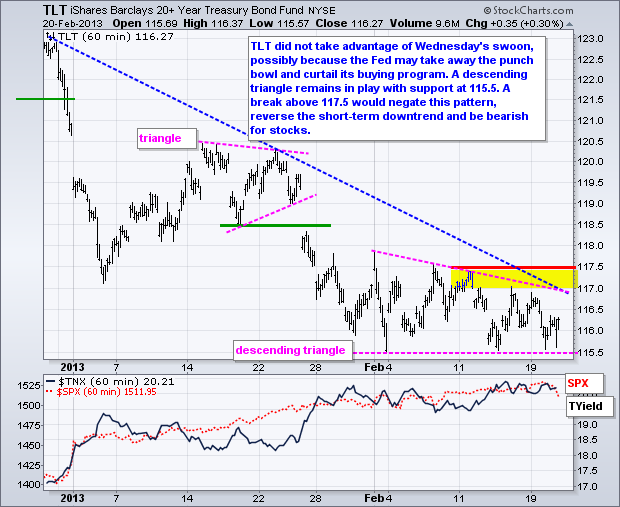
To add insult to injury, the Fed minutes indicated some divisions within the Fed on quantitative easing. Some members were concerned with increasing risk and diminishing returns of QE. The decline in stocks accelerated after this news. The 20+ Year T-Bond ETF (TLT) managed to bounce with the decline in stocks, but this bounce was rather muted. Perhaps the treasury market is also afraid that the Fed will curtail its purchases sooner rather than later. Even so, treasuries are the ultimate risk-off asset and a breakout at 117.50 would signal a return to risk-off.
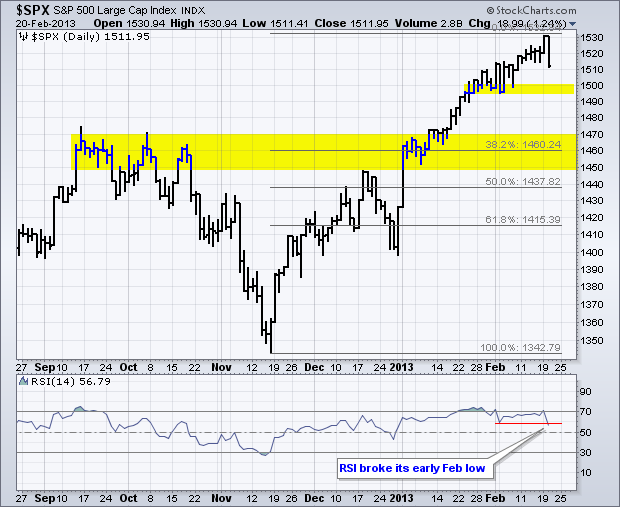
While the bigger trend is still up for the S&P 500, we could see an extended corrective period to digest the gains since mid November, especially if TLT breaks out. $SPX advanced 13% from mid November to mid February. There was a low-volume pullback between Christmas and New Years, as well as a one-day decline on February 4th. Stocks recovered immediately after 4-Feb decline, but may not be so lucky this time. The 1490-1500 area marks the first support zone to watch on the daily chart. Further down, the 1460 area marks the next support zone. Notice that RSI broke below its prior low and started a downtrend with Wednesday's decline. And finally, the Fed minutes are behind us, but the sequester will come to a head in the coming weeks.
**************************************************************************
**************************************************************************
**************************************************************************
**************************************************************************
**************************************************************************
Key Reports and Events:
Thu - Feb 21 - 08:30 - Jobless Claims
Thu - Feb 21 - 08:30 - Consumer Price Index (CPI)
Thu - Feb 21 - 09:00 - Flash Purchasing Managers Index (PMI)
Thu - Feb 21 - 10:00 - Existing Home Sales
Thu - Feb 21 - 10:00 - Philadelphia Fed
Thu - Feb 21 - 10:00 - Leading Economic Indicators
Thu - Feb 21 - 10:30 - Natural Gas Inventories
Thu - Feb 21 - 11:00 - Oil Inventories
Sun - Feb 24 - 10:00 – Italian Parliamentary Elections
Fri – Mar 01 - 23:59 – Sequester Takes Effect (unless...)
Wed – Mar 27 - 23:59 – Government Shut Down Deadline
Wed – May 15 - 23:59 – New Debt Ceiling Deadline lexicon prognosis
Charts of Interest: Tuesday and Thursday
This commentary and charts-of-interest are designed to stimulate thinking. This analysis is
not a recommendation to buy, sell, hold or sell short any security (stock ETF or otherwise).
We all need to think for ourselves when it comes to trading our own accounts. First, it is
the only way to really learn. Second, we are the only ones responsible for our decisions.
Think of these charts as food for further analysis. Before making a trade, it is important
to have a plan. Plan the trade and trade the plan. Among other things, this includes setting
a trigger level, a target area and a stop-loss level. It is also important to plan for three
possible price movements: advance, decline or sideways. Have a plan for all three scenarios
BEFORE making the trade. Consider possible holding times. And finally, look at overall market
conditions and sector/industry performance.

About the author:
Arthur Hill, CMT, is the Chief Technical Strategist at TrendInvestorPro.com. Focusing predominantly on US equities and ETFs, his systematic approach of identifying trend, finding signals within the trend, and setting key price levels has made him an esteemed market technician. Arthur has written articles for numerous financial publications including Barrons and Stocks & Commodities Magazine. In addition to his Chartered Market Technician (CMT) designation, he holds an MBA from the Cass Business School at City University in London.
Learn More


