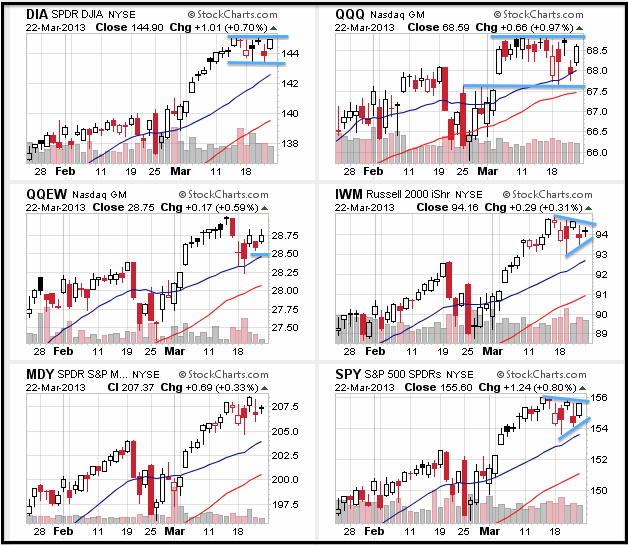
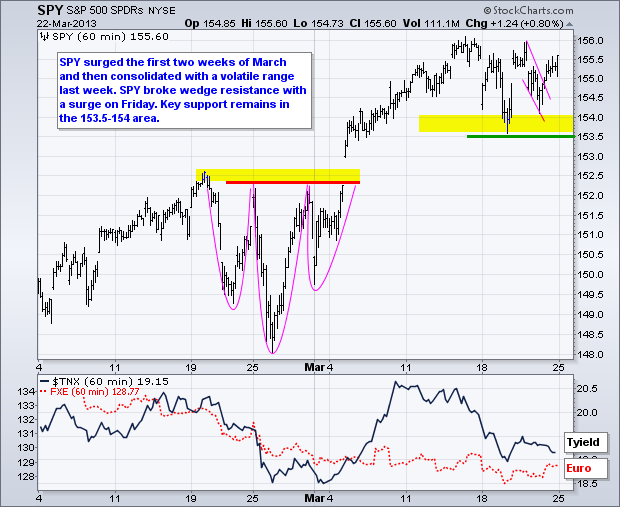
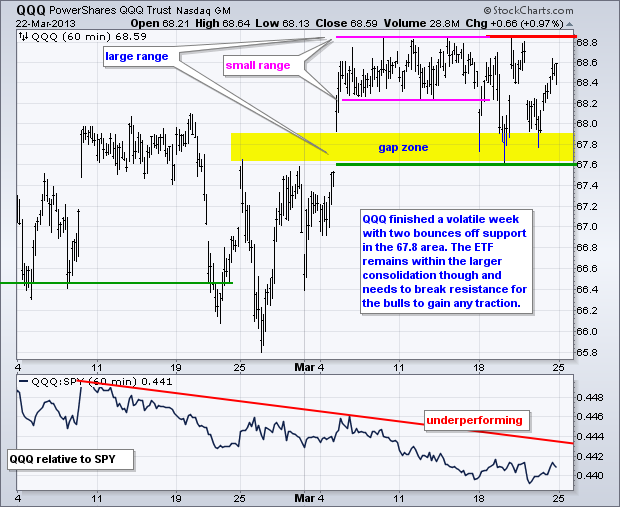
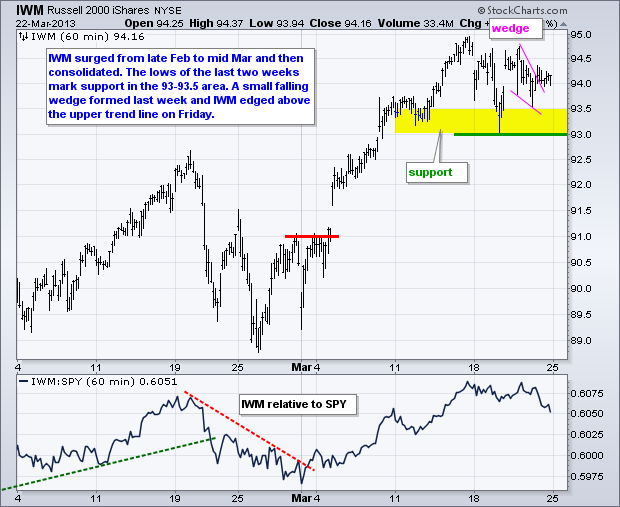
Cyprus has just a few days left – to dominate the news. Yes, once again, last-minute negotiations produced a bailout deal in the 13th hour. What a surprise. Cyprus will officially move to the back burner on Tuesday and we can get back to the real business at hand. US stocks were volatile last week, but ended the week with little change. The S&P 500 ETF (SPY) was down .15%, the Russell 2000 ETF (IWM) declined .62% and the Nasdaq 100 ETF (QQQ) advanced .12%. Despite a big hit from Oracle on Thursday, Microsoft and Apple closed higher last week. Note that Apple moved above its 50-day moving average for the first time since early October. As the CandleGlance charts below show, some of the major index ETFs simply consolidated the last 6-7 days. DIA formed a flat flag, while IWM and SPY formed pennants. QQQ held the gap with a big three week consolidation. The bulls still get the benefit of the doubt because the medium-term trends are up and these short-term consolidations look like bullish continuation patterns.
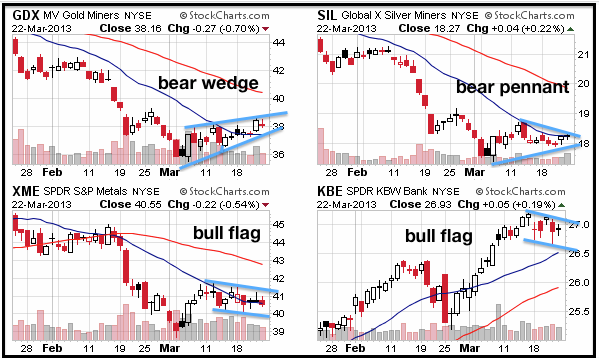
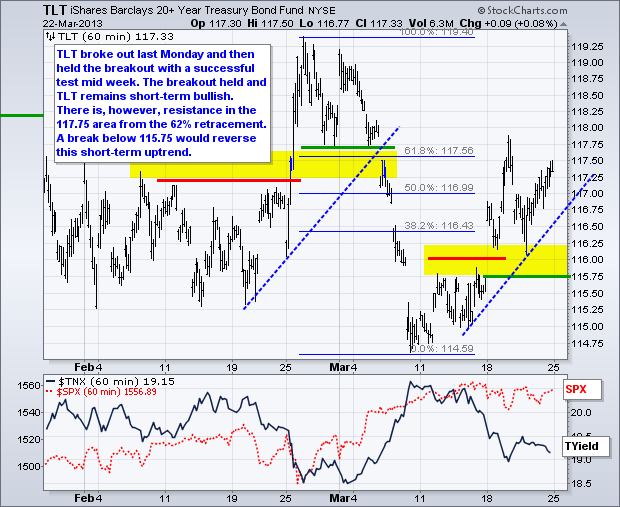
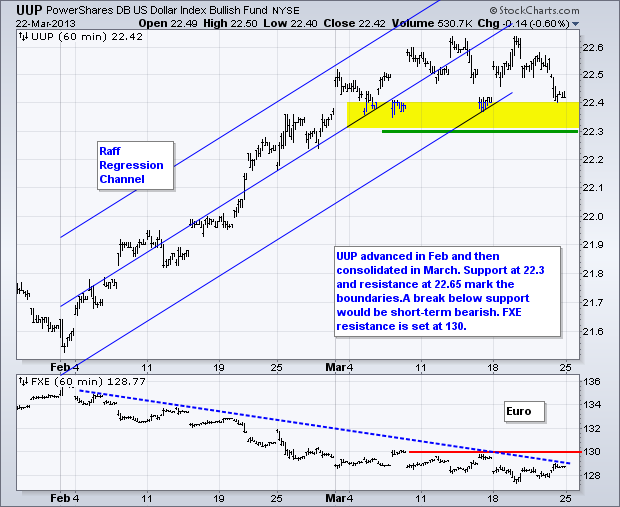
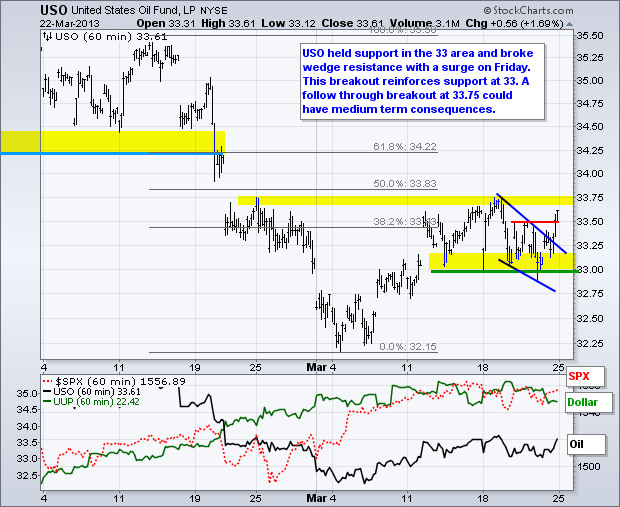
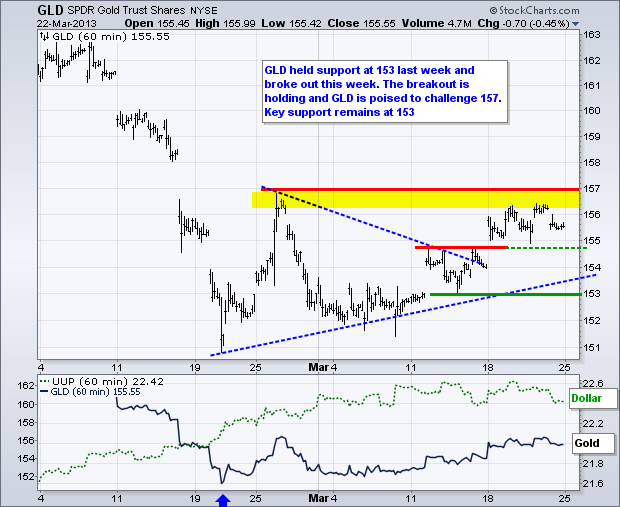
With Cyprus out of the way, the markets can return to a sense of normalcy. While I am not sure if Cyprus triggered the two-week bounce in gold, it seems that we may see a return to risk-on in the next few days. This could benefit stocks, oil and the Euro. It would be negative for Treasuries and the Dollar. Note that the Silver Miners ETF (SIL) and the Gold Miners ETF (GDX) have bearish continuation patterns working. Elsewhere, I am wondering if the miners can break from their bearish funk. The Metals & Mining SPDR (XME) has a potentially bullish flag working and a breakout at 41.5 would be positive. The KBW Bank Index SPDR (KBE) also has a bullish flag working as it trades new a 52-week high.
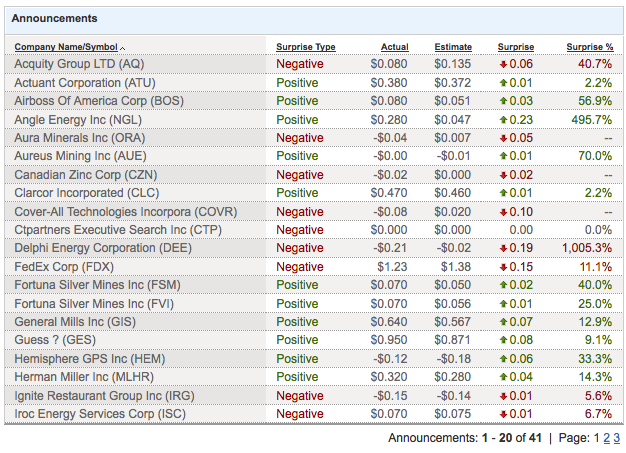
There are some concerns with earnings, both past and future. Oracle, FedEx and Caterpillar disappointed Wall Street last week. These three companies are big and global. Perhaps weakness outside of the US is to blame. On the flipside, companies with less exposure to Europe and Asia may have the upper leg going forward. This means small-caps and mid-caps. Last week's early reports and guidance were not inspiring. We are still in the warning period for one more week. First quarter earnings reports will then start to flow in mid April. CNBC has a pretty nice earnings calendar that shows the surprise type and percent surprise. You can even sort by the column headings to compare the positive surprises with the negative surprises.
**************************************************************************
**************************************************************************
**************************************************************************
**************************************************************************
**************************************************************************
Key Reports and Events (all times Eastern):
Tue - Mar 26 - 08:30 - Durable Orders
Tue - Mar 26 - 09:00 - Case-Shiller 20-city Index
Tue - Mar 26 - 10:00 - Consumer Confidence
Tue - Mar 26 - 10:00 - New Home Sales
Wed - Mar 27 - 07:00 - MBA Mortgage Index
Wed - Mar 27 - 10:00 - Pending Home Sales
Wed - Mar 27 - 10:30 - Oil Inventories
Thu - Mar 28 - 08:30 - Jobless Claims
Thu - Mar 28 - 08:30 - GDP
Thu - Mar 28 - 09:45 - Chicago PMI
Thu - Mar 28 - 10:30 - Natural Gas Inventories
Fri - Mar 29 - 08:30 - Personal Income & Spending
Fri - Mar 29 - 09:55 - Michigan Sentiment
Charts of Interest: Tuesday and Thursday
This commentary and charts-of-interest are designed to stimulate thinking. This analysis is
not a recommendation to buy, sell, hold or sell short any security (stock ETF or otherwise).
We all need to think for ourselves when it comes to trading our own accounts. First, it is
the only way to really learn. Second, we are the only ones responsible for our decisions.
Think of these charts as food for further analysis. Before making a trade, it is important
to have a plan. Plan the trade and trade the plan. Among other things, this includes setting
a trigger level, a target area and a stop-loss level. It is also important to plan for three
possible price movements: advance, decline or sideways. Have a plan for all three scenarios
BEFORE making the trade. Consider possible holding times. And finally, look at overall market
conditions and sector/industry performance.

