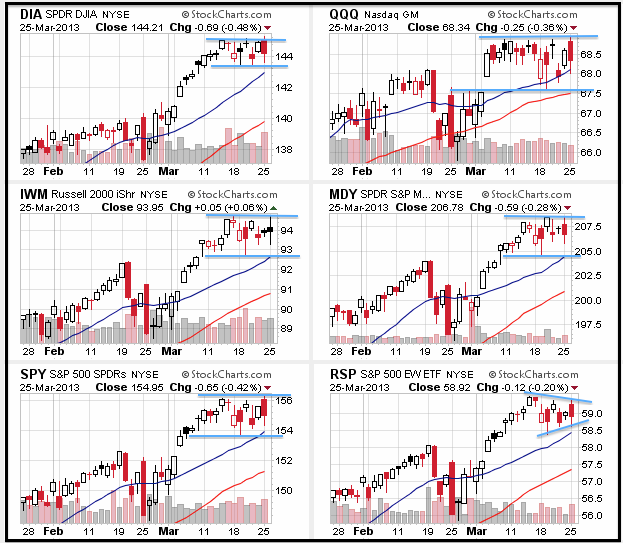
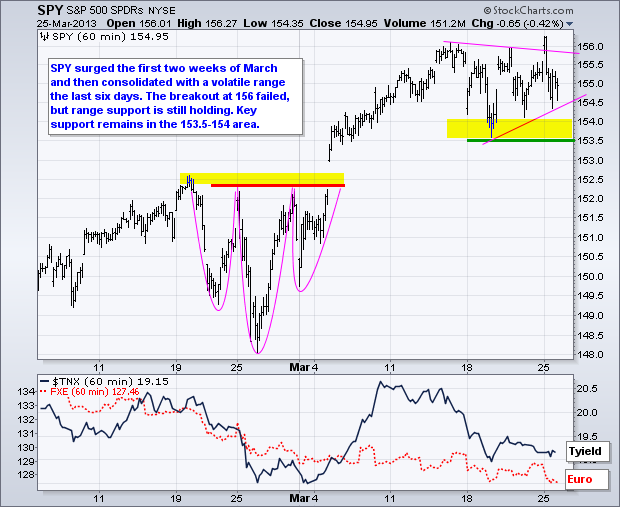
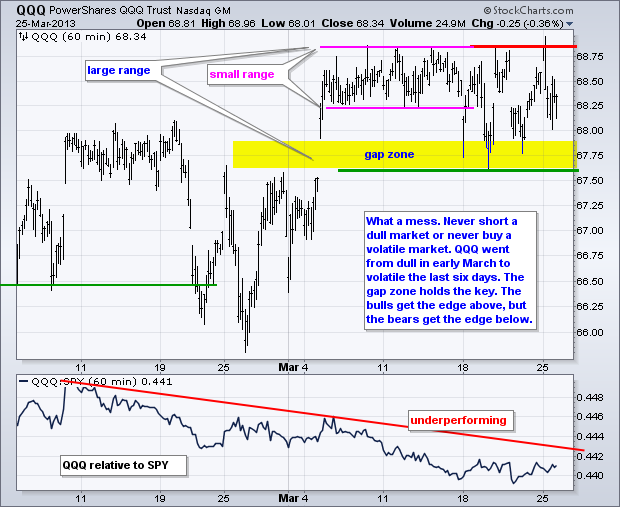
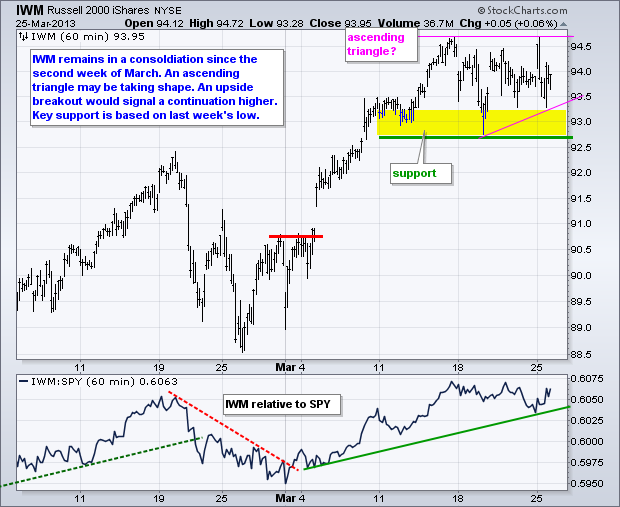
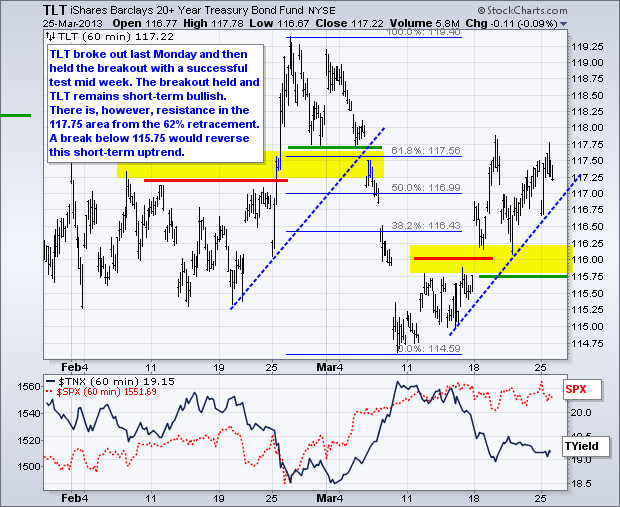
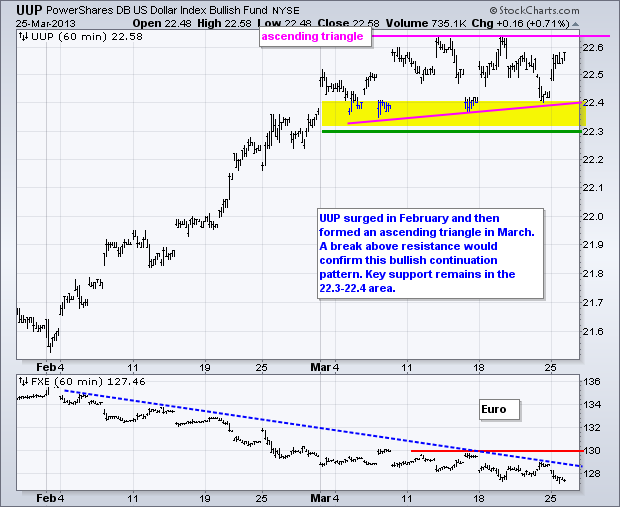
It was a topsy-turvy day for the markets. Stocks opened strong on the heels of a Cyprus deal, but weakened as the details sunk in and EU comments suggested that this "unique" deal could be a template for future bailouts. While this news is certainly disconcerting for European deposit holders, I am not sure what, if any, affect it will have on the US economy. Truth be told, I am more interested in today's durable goods report and Thursday's Purchasing Managers Index (PMI). In any case, the major index ETFs closed slightly lower on the day and the damage was limited. All sectors were lower with industrials (-.89%) and materials (-.77%) leading the way. Again, the declines were limited. Basically, the major index ETFs have been consolidating the last few weeks. This means buying pressure and selling pressure have equalized. It is a transition phase. A transition to what? Either a continuation higher or a reversal lower. The medium-term trends are clearly up and the bulls still get the benefit of the doubt.

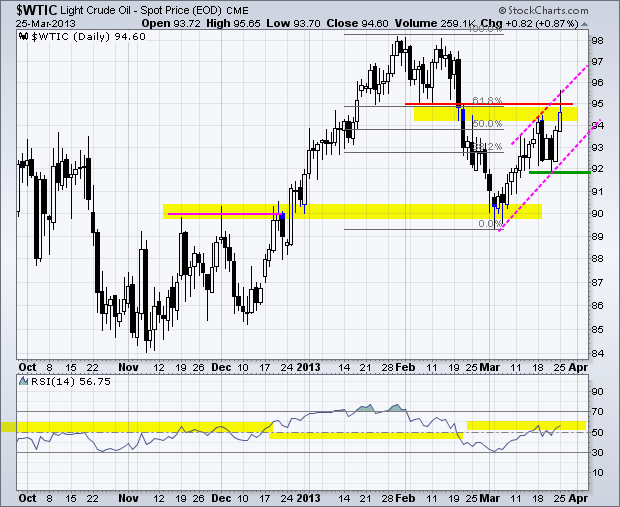
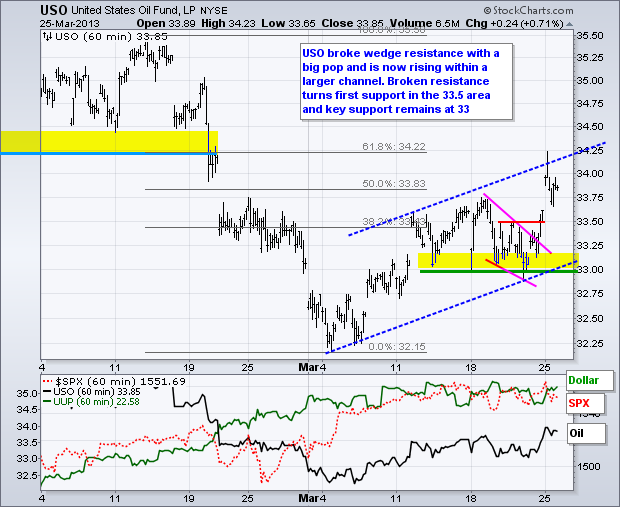
Industrial commodities remain in the dumps, but oil surged over the last two days. Spot Light Crude ($WTIC) is on the verge of a breakout at 95, despite a strong Dollar. After some wild swings last week and a bounce on Monday, a rising channel is taking shape this month with support just below 92.
**************************************************************************
**************************************************************************
**************************************************************************
**************************************************************************
**************************************************************************
Key Reports and Events (all times Eastern):
Tue - Mar 26 - 08:30 - Durable Orders
Tue - Mar 26 - 09:00 - Case-Shiller 20-city Index
Tue - Mar 26 - 10:00 - Consumer Confidence
Tue - Mar 26 - 10:00 - New Home Sales
Wed - Mar 27 - 07:00 - MBA Mortgage Index
Wed - Mar 27 - 10:00 - Pending Home Sales
Wed - Mar 27 - 10:30 - Oil Inventories
Thu - Mar 28 - 08:30 - Jobless Claims
Thu - Mar 28 - 08:30 - GDP
Thu - Mar 28 - 09:45 - Chicago PMI
Thu - Mar 28 - 10:30 - Natural Gas Inventories
Fri - Mar 29 - 08:30 - Personal Income & Spending
Fri - Mar 29 - 09:55 - Michigan Sentiment
Charts of Interest: Tuesday and Thursday
This commentary and charts-of-interest are designed to stimulate thinking. This analysis is
not a recommendation to buy, sell, hold or sell short any security (stock ETF or otherwise).
We all need to think for ourselves when it comes to trading our own accounts. First, it is
the only way to really learn. Second, we are the only ones responsible for our decisions.
Think of these charts as food for further analysis. Before making a trade, it is important
to have a plan. Plan the trade and trade the plan. Among other things, this includes setting
a trigger level, a target area and a stop-loss level. It is also important to plan for three
possible price movements: advance, decline or sideways. Have a plan for all three scenarios
BEFORE making the trade. Consider possible holding times. And finally, look at overall market
conditions and sector/industry performance.


**************************************************************************

**************************************************************************

**************************************************************************

**************************************************************************

**************************************************************************
Key Reports and Events (all times Eastern):
Tue - Mar 26 - 08:30 - Durable Orders
Tue - Mar 26 - 09:00 - Case-Shiller 20-city Index
Tue - Mar 26 - 10:00 - Consumer Confidence
Tue - Mar 26 - 10:00 - New Home Sales
Wed - Mar 27 - 07:00 - MBA Mortgage Index
Wed - Mar 27 - 10:00 - Pending Home Sales
Wed - Mar 27 - 10:30 - Oil Inventories
Thu - Mar 28 - 08:30 - Jobless Claims
Thu - Mar 28 - 08:30 - GDP
Thu - Mar 28 - 09:45 - Chicago PMI
Thu - Mar 28 - 10:30 - Natural Gas Inventories
Fri - Mar 29 - 08:30 - Personal Income & Spending
Fri - Mar 29 - 09:55 - Michigan Sentiment
Charts of Interest: Tuesday and Thursday
This commentary and charts-of-interest are designed to stimulate thinking. This analysis is
not a recommendation to buy, sell, hold or sell short any security (stock ETF or otherwise).
We all need to think for ourselves when it comes to trading our own accounts. First, it is
the only way to really learn. Second, we are the only ones responsible for our decisions.
Think of these charts as food for further analysis. Before making a trade, it is important
to have a plan. Plan the trade and trade the plan. Among other things, this includes setting
a trigger level, a target area and a stop-loss level. It is also important to plan for three
possible price movements: advance, decline or sideways. Have a plan for all three scenarios
BEFORE making the trade. Consider possible holding times. And finally, look at overall market
conditions and sector/industry performance.

About the author:
Arthur Hill, CMT, is the Chief Technical Strategist at TrendInvestorPro.com. Focusing predominantly on US equities and ETFs, his systematic approach of identifying trend, finding signals within the trend, and setting key price levels has made him an esteemed market technician. Arthur has written articles for numerous financial publications including Barrons and Stocks & Commodities Magazine. In addition to his Chartered Market Technician (CMT) designation, he holds an MBA from the Cass Business School at City University in London.
Learn More


