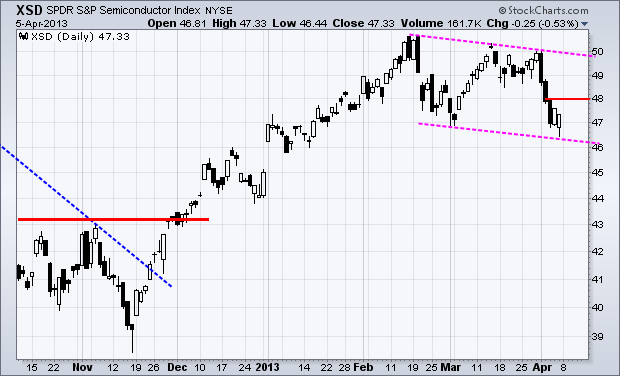
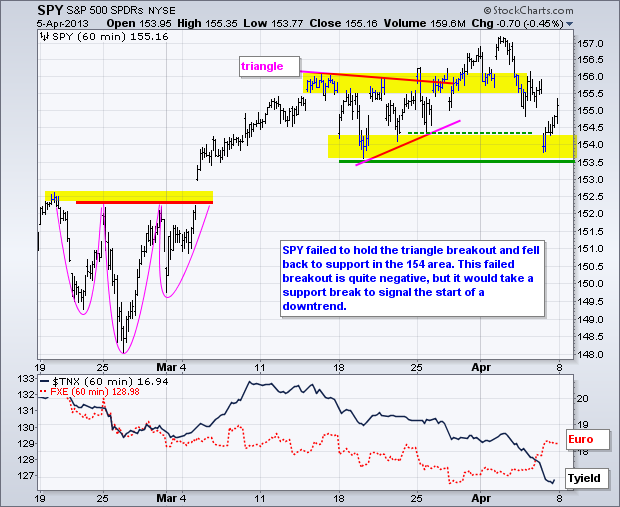
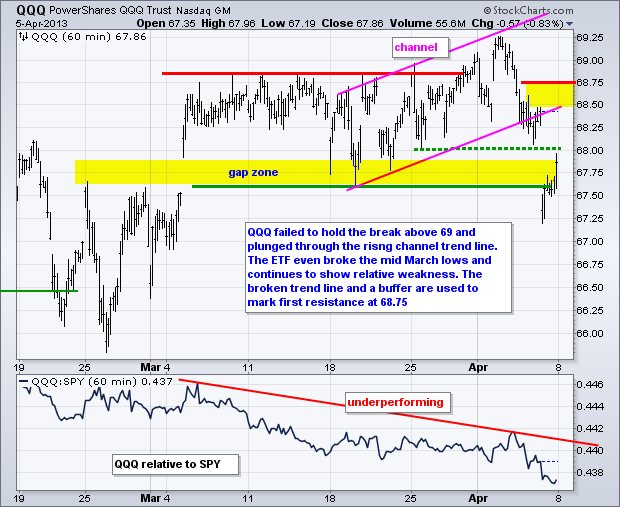
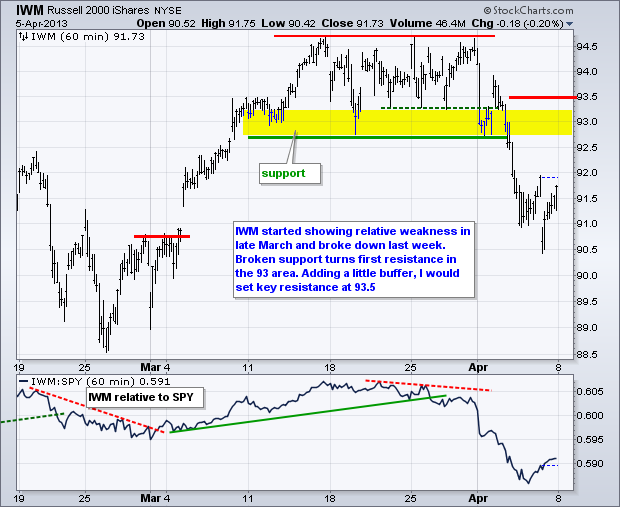
Stocks were hit hard in early trading on Friday, but managed to firm during the day and even mount a recovery in the afternoon. The Nasdaq 100 ETF (QQQ) and S&P 500 ETF (SPY) still finished modestly lower. The S&P Midcap SPDR (MDY) surged and almost closed even on the day. Techs got hit hard last week, but the Semiconductor SPDR (XSD) managed to form white candlesticks on Thursday and Friday. This means XSD moved higher after each open. In essence, a piercing pattern formed over the last three days. Overall, trend is down since mid February with a lower high and lower low. However, this could be a corrective channel designed to work off the overbought conditions that existed after the surge from ±39 to ±50 (mid November to mid February). A surge above 48 would provide the first signs of strength.

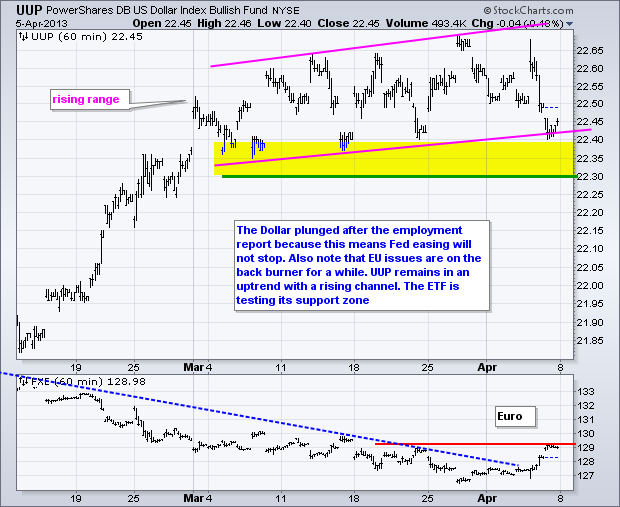
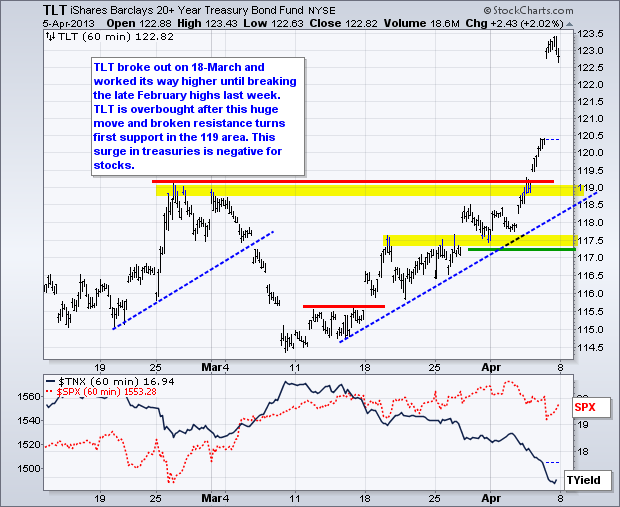
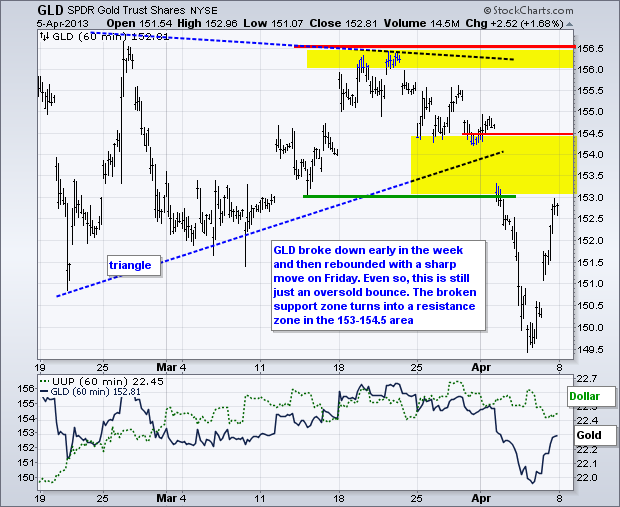
A disappointing employment report got the blame for Friday's selling pressure as non-farm payrolls expanded by just 88K. Even though this number was well below expectations, note that one month does not make a trend, the number is still positive and this report is subject to revision. Nevertheless, the markets made some serious adjustments with the 20+ Year T-Bond ETF (TLT) surging to complete a huge week. The Dollar was hit and gold rebounded as the prospects for continued quantitative easing increased. Despite these big moves at the end of the week, the Dollar remains in a medium-term uptrend and gold remains in a medium-term downtrend. We will get more insight on the future of QE when the Fed releases its minutes on Wednesday. More importantly, we will get an idea of the consumer with the retail sales report on Friday. With consumer spending driving two thirds of GDP, this report is one to watch for clues on the economy. Alcoa kicks off earnings season with its report on Monday after the close. Note that S&P 500 earnings decreased 1.8% in the first quarter. According to Bloomberg, this was the first year-on-year decrease since 2009. Another quarter of disappointment could put further pressure on equities as the six month cycle turns bearish in May.
**************************************************************************
**************************************************************************
**************************************************************************
**************************************************************************
**************************************************************************
Key Reports and Events (all times Eastern):
Tue - Apr 09 - 10:00 - Wholesale Inventories
Wed - Apr 10 - 07:00 - MBA Mortgage Index
Wed - Apr 10 - 10:30 - Oil Inventories
Wed - Apr 10 - 14:00 - FOMC Minutes
Thu - Apr 11 - 08:30 - Jobless Claims
Thu - Apr 11 - 10:30 - Natural Gas Inventories
Fri - Apr 12 - 08:30 - Retail Sales
Fri - Apr 12 - 08:30 - Producer Price Index (PPI)
Fri - Apr 12 - 09:55 - Michigan Sentiment
Fri - Apr 12 - 10:00 - Business Inventories
Charts of Interest: Tuesday and Thursday
This commentary and charts-of-interest are designed to stimulate thinking. This analysis is
not a recommendation to buy, sell, hold or sell short any security (stock ETF or otherwise).
We all need to think for ourselves when it comes to trading our own accounts. First, it is
the only way to really learn. Second, we are the only ones responsible for our decisions.
Think of these charts as food for further analysis. Before making a trade, it is important
to have a plan. Plan the trade and trade the plan. Among other things, this includes setting
a trigger level, a target area and a stop-loss level. It is also important to plan for three
possible price movements: advance, decline or sideways. Have a plan for all three scenarios
BEFORE making the trade. Consider possible holding times. And finally, look at overall market
conditions and sector/industry performance.

About the author:
Arthur Hill, CMT, is the Chief Technical Strategist at TrendInvestorPro.com. Focusing predominantly on US equities and ETFs, his systematic approach of identifying trend, finding signals within the trend, and setting key price levels has made him an esteemed market technician. Arthur has written articles for numerous financial publications including Barrons and Stocks & Commodities Magazine. In addition to his Chartered Market Technician (CMT) designation, he holds an MBA from the Cass Business School at City University in London.
Learn More


