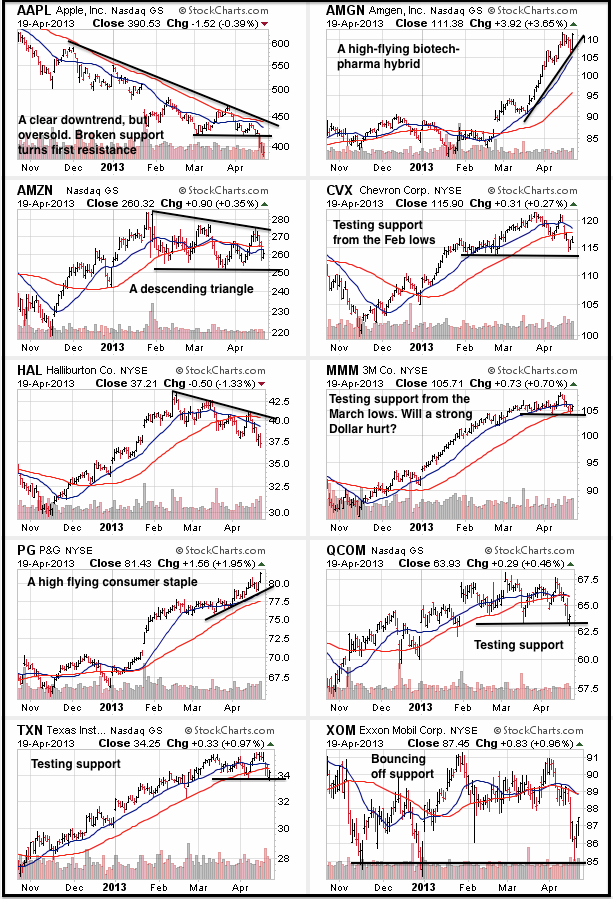
It is a HUGE week for earnings, which means we could see extra volatility the next several days. Texas Instruments reports on Monday, Apple reports Tuesday after the close, Qualcom is on deck Wednesday and Amazon reports on Thursday. I am not going to mention Friday because it seems too far in the future right now and the markets may be exhausted by then. Earnings reports have been less than stellar so far. Of the S&P 500 companies that have reported, Bespokeinvest.com notes that more than 56.1% have missed their revenue estimates. This is the lowest number since the first quarter of 2009. Most notably, IBM missed last week and the shares plunged over 8%. This big tech company should be considered a bellwether for the market overall. The CandleGlance charts show 10 top stocks that are reporting earnings this week. The two strongest, Amgen and Procter&Gamble, come from the two strongest sectors (healthcare and consumer staples). Several of these stocks are testing support after declines this month. In particular, I will be watching MMM because this multinational could be hurt from a strong Dollar. Also note that AMZN has a descending triangle taking shape this year.

**************************************************************************
**************************************************************************
**************************************************************************
**************************************************************************
**************************************************************************
Key Reports and Events (all times Eastern):
Mon - Apr 22 - 10:00 - Existing Home Sales (CAT, HAL, TXN)
Tue - Apr 23 - 09:00 - FHFA Housing Price Index (AMGN, AAPL, JNPR)
Tue - Apr 23 - 10:00 - New Home Sales
Wed - Apr 24 - 07:00 - MBA Mortgage Index (EMC, MMM, QCOM, PG, XLNX)
Wed - Apr 24 - 08:30 - Durable Good Orders
Wed - Apr 24 - 10:30 - Oil Inventories
Thu - Apr 25 - 08:30 - Jobless Claims (AMZN, ALTR, XOM)
Thu - Apr 25 - 10:30 - Natural Gas Inventories
Fri - Apr 26 - 08:30 – GDP (CVX, TYC, WY)
Fri - Apr 26 - 09:55 - Michigan Sentiment
Charts of Interest: Tuesday and Thursday
This commentary and charts-of-interest are designed to stimulate thinking. This analysis is
not a recommendation to buy, sell, hold or sell short any security (stock ETF or otherwise).
We all need to think for ourselves when it comes to trading our own accounts. First, it is
the only way to really learn. Second, we are the only ones responsible for our decisions.
Think of these charts as food for further analysis. Before making a trade, it is important
to have a plan. Plan the trade and trade the plan. Among other things, this includes setting
a trigger level, a target area and a stop-loss level. It is also important to plan for three
possible price movements: advance, decline or sideways. Have a plan for all three scenarios
BEFORE making the trade. Consider possible holding times. And finally, look at overall market
conditions and sector/industry performance.

About the author:
Arthur Hill, CMT, is the Chief Technical Strategist at TrendInvestorPro.com. Focusing predominantly on US equities and ETFs, his systematic approach of identifying trend, finding signals within the trend, and setting key price levels has made him an esteemed market technician. Arthur has written articles for numerous financial publications including Barrons and Stocks & Commodities Magazine. In addition to his Chartered Market Technician (CMT) designation, he holds an MBA from the Cass Business School at City University in London.
Learn More


