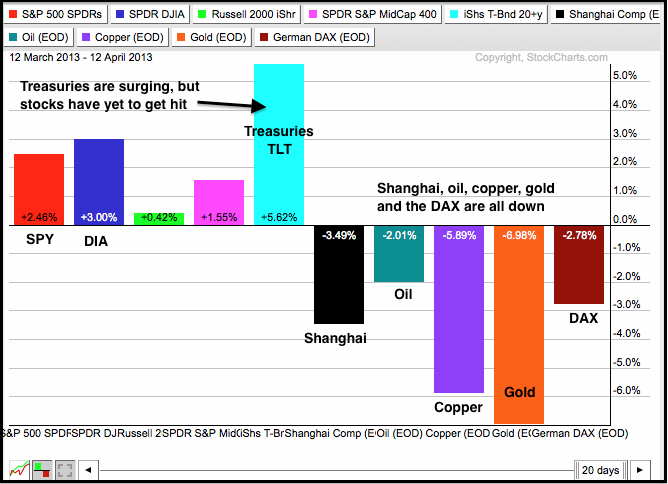
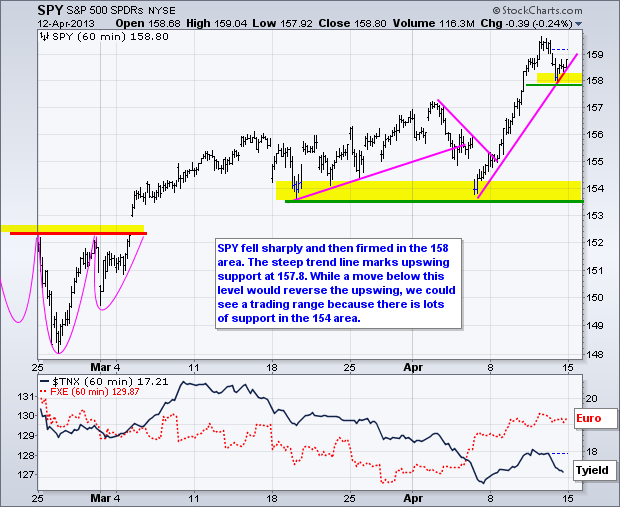
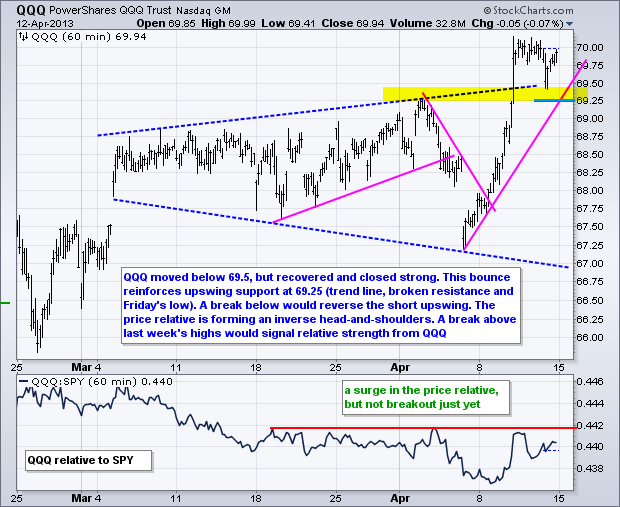
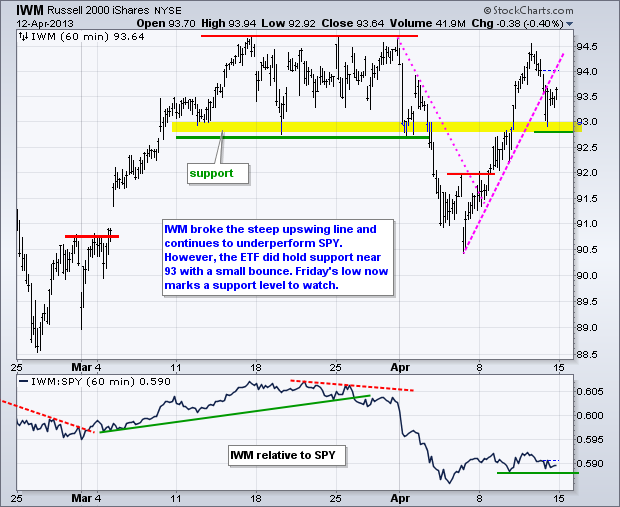
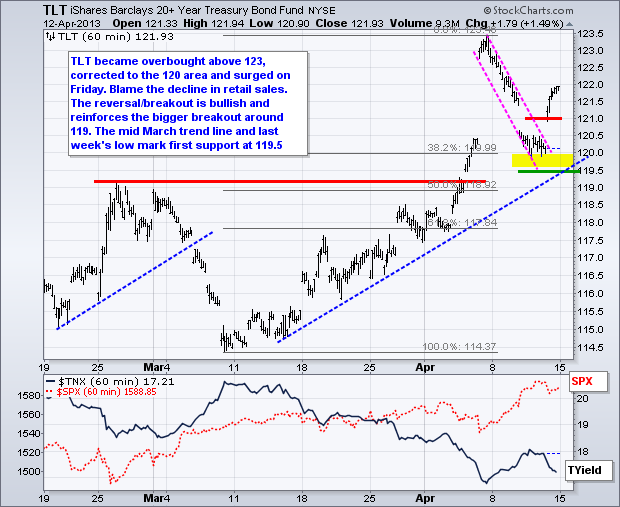
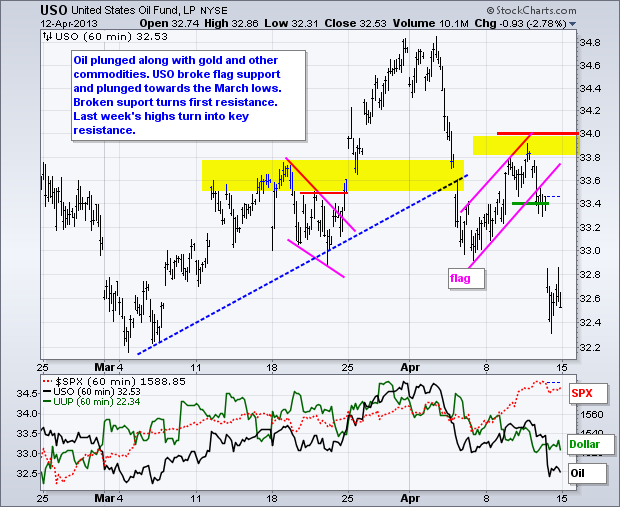
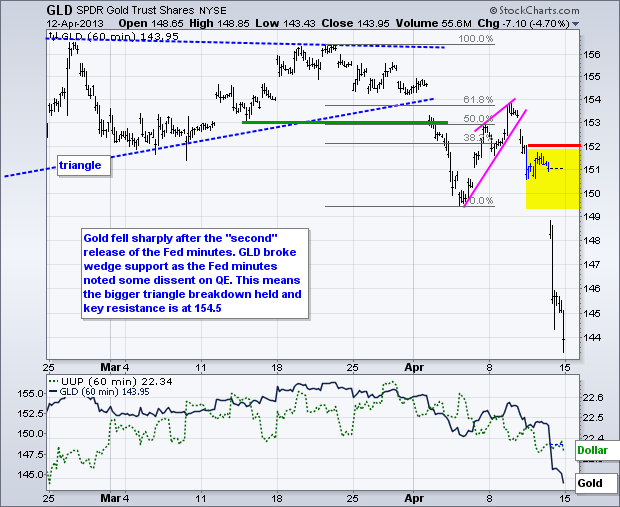
Stocks came under early selling pressure on Friday morning after an unexpected decline in March retail sales. Selling pressure, however, lasted less than two hours as the major index ETFs found their footing around 11AM and edged higher the rest of the day. Despite this post-open bounce, SPY, MDY, IWM and QQQ still finished lower on the day. QQQ had the strongest recovery and closed down just a fraction (-.07%). The ability to firm and recover is impressive, especially after another disappointment on the economic front. Nevertheless, there are some serious weak spots in the market and all is not well. The Basic Materials SPDR (XLB) and the Energy SPDR (XLE) were slammed as oil and metals took big hits. Spot Light Crude ($WTIC) fell around 5%, Spot Gold ($GOLD) was down over 5% and Spot Copper ($COPPER) fell 2.64%, in just one day. The blame goes to weakening economic indicators out of the US. Note that retail sales fell in March, consumer sentiment hit a nine month low and March non-farm payrolls were very weak.
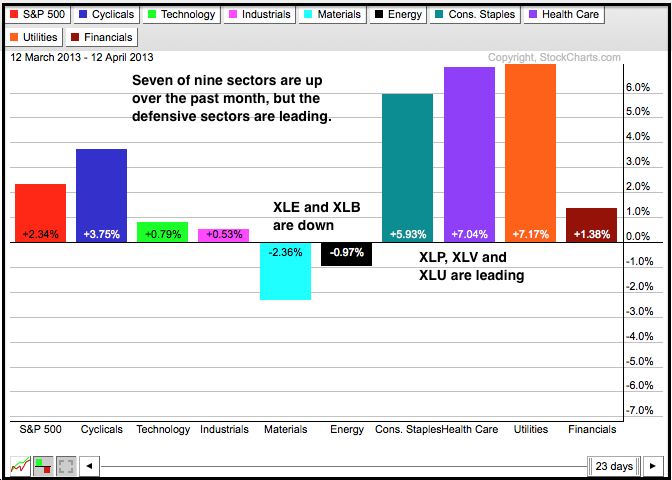

This economic soft-patch would not be a big deal if the S&P 500 and other indices were trading at lower levels. Instead, the S&P 500 and the Dow Industrials are trading near multi-year highs and priced to perfection as we head into first quarter earnings. Strength in the S&P 500 ETF (SPY) and Dow Industrials SPDR (DIA), however, masks some underlying weakness in the Russell 2000 ETF (IWM) and S&P MidCap 400 SPDR (MDY). The latter two failed to break above their March highs and show relative weakness the last few weeks. Even though the overall trends remain up, it is hard to be too bullish on stocks right now. Also note that the six month cycle turns bearish in the next week or two and the market in general is ripe for a corrective period.
**************************************************************************
**************************************************************************
**************************************************************************
**************************************************************************
**************************************************************************
Key Reports and Events (all times Eastern):
Mon - Apr 15 - 08:30 - Empire Manufacturing
Mon - Apr 15 - 10:00 - NAHB Housing Market Index
Tue - Apr 16 - 08:30 – Consumer Price Index (CPI)
Tue - Apr 16 - 08:30 - Housing Starts/Building Permits
Tue - Apr 16 - 09:15 - Industrial Production
Wed - Apr 17 - 07:00 - MBA Mortgage Index
Wed - Apr 17 - 10:30 - Oil Inventories
Wed - Apr 17 - 14:00 - Fed Beige Book
Thu - Apr 18 - 08:30 - Jobless Claims
Thu - Apr 18 - 10:00 - Philadelphia Fed Report
Thu - Apr 18 - 10:00 - Leading Indicators
Thu - Apr 18 - 10:30 - Natural Gas Inventories
Charts of Interest: Tuesday and Thursday
This commentary and charts-of-interest are designed to stimulate thinking. This analysis is
not a recommendation to buy, sell, hold or sell short any security (stock ETF or otherwise).
We all need to think for ourselves when it comes to trading our own accounts. First, it is
the only way to really learn. Second, we are the only ones responsible for our decisions.
Think of these charts as food for further analysis. Before making a trade, it is important
to have a plan. Plan the trade and trade the plan. Among other things, this includes setting
a trigger level, a target area and a stop-loss level. It is also important to plan for three
possible price movements: advance, decline or sideways. Have a plan for all three scenarios
BEFORE making the trade. Consider possible holding times. And finally, look at overall market
conditions and sector/industry performance.

About the author:
Arthur Hill, CMT, is the Chief Technical Strategist at TrendInvestorPro.com. Focusing predominantly on US equities and ETFs, his systematic approach of identifying trend, finding signals within the trend, and setting key price levels has made him an esteemed market technician. Arthur has written articles for numerous financial publications including Barrons and Stocks & Commodities Magazine. In addition to his Chartered Market Technician (CMT) designation, he holds an MBA from the Cass Business School at City University in London.
Learn More


