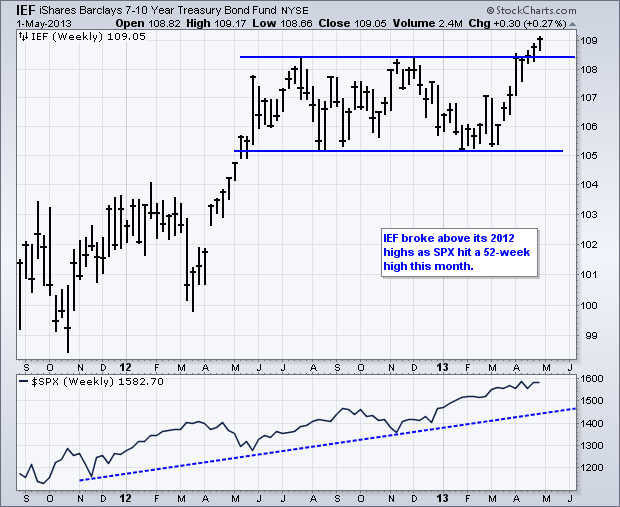
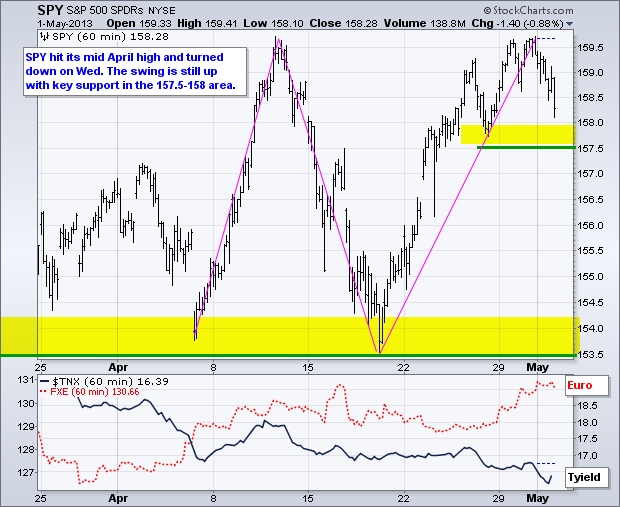
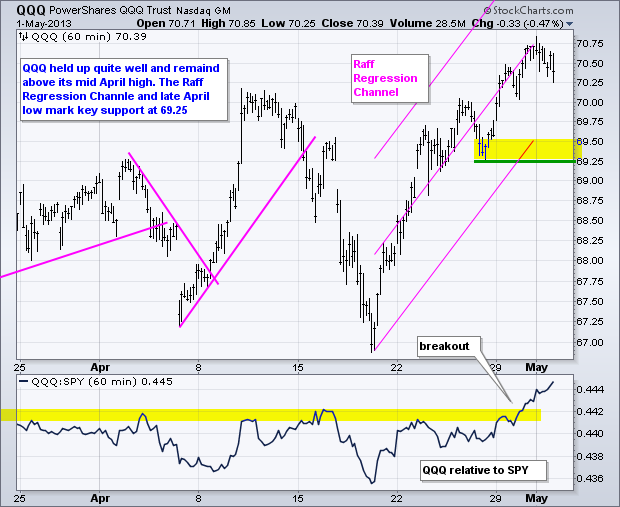
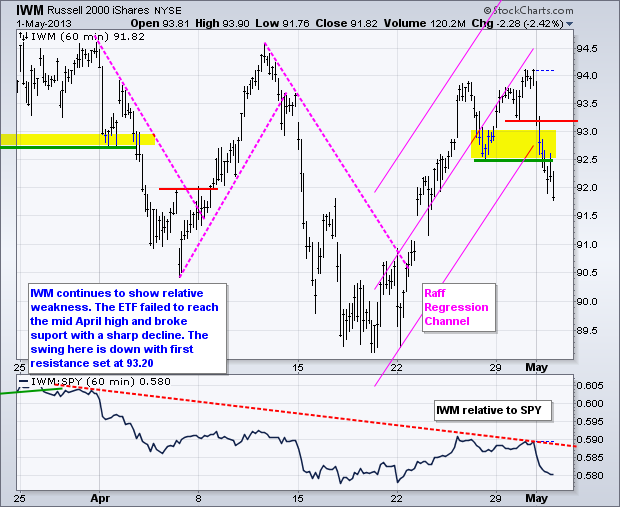
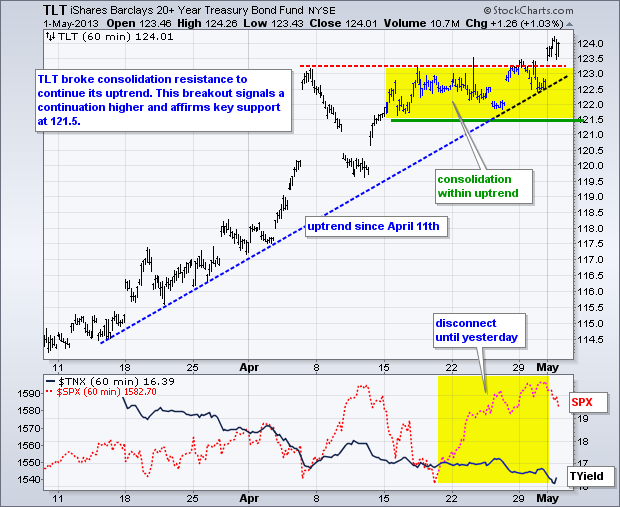
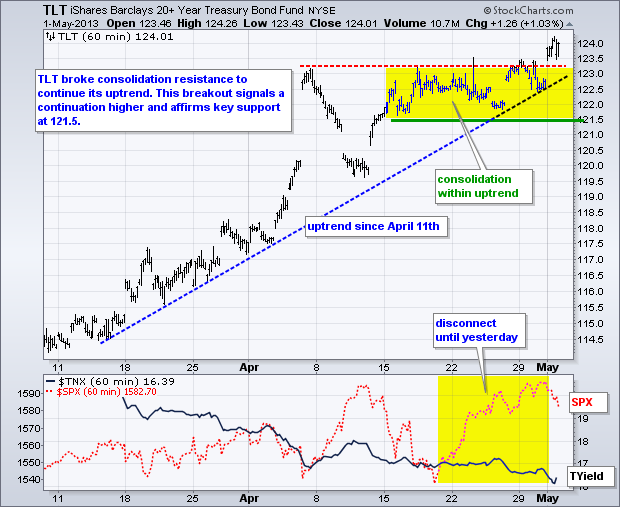
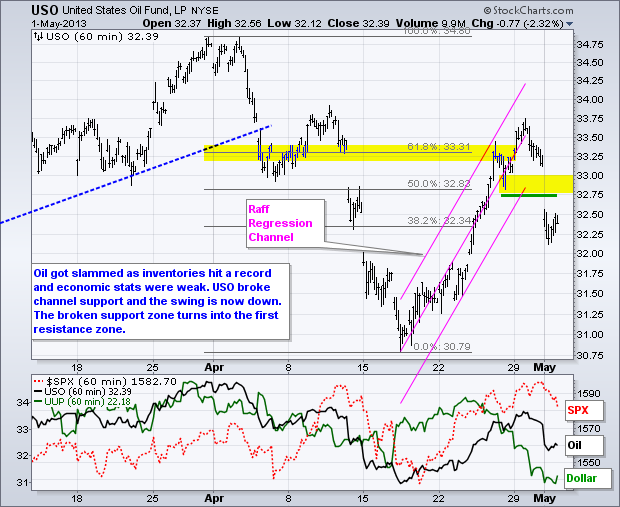
Stocks started the day weak, ignored the Fed and finished the day weak. Small-caps led the way lower with the Russell 2000 ETF (IWM) falling over 2%. The Nasdaq 100 ETF (QQQ) held up the best with the smallest decline. Treasuries moved higher as economic reports continued to disappoint. The ISM Manufacturing Index came in below expectations (50.7 versus an expected 51). The index is still above 50, but dangerously close to breaking this key level. The ADP Employment report also missed expectations with only 119,000 new jobs in added in April. This compares to 131,000 in March and expectations of 155,000. This is not a good sign for Friday's employment report. The 20+ Year T-Bond ETF (TLT) broke above its April highs and remains in an uptrend, which is negative for stocks. Elsewhere, commodities fell sharply because the Chinese and Australian PMIs also missed expectations. Spot Light Crude ($WTIC) fell over 2%, Spot Copper ($COPPER) fell almost 4% and Spot Silver ($SILVER) fell over 2.5% on the day. Even though stocks finally succumbed to selling pressure on Wednesday, the big disconnects remain over the last two months. Stocks are ignoring weakness in the economy, a 52-week low in copper and a 52-week high in the 7-10 year T-Bond ETF (IEF).

**************************************************************************
**************************************************************************
**************************************************************************
**************************************************************************
**************************************************************************
Key Reports and Events (all times Eastern):
Thu - May 02 - 07:30 - Challenger Job Cuts
Thu - May 02 - 08:30 - Jobless Claims
Thu - May 02 - 10:30 - Natural Gas Inventories
Fri - May 03 - 08:30 - Employment Report
Fri - May 03 - 10:00 - Factory Orders
Fri - May 03 - 10:00 - ISM Services Index
Charts of Interest: Tuesday and Thursday
This commentary and charts-of-interest are designed to stimulate thinking. This analysis is
not a recommendation to buy, sell, hold or sell short any security (stock ETF or otherwise).
We all need to think for ourselves when it comes to trading our own accounts. First, it is
the only way to really learn. Second, we are the only ones responsible for our decisions.
Think of these charts as food for further analysis. Before making a trade, it is important
to have a plan. Plan the trade and trade the plan. Among other things, this includes setting
a trigger level, a target area and a stop-loss level. It is also important to plan for three
possible price movements: advance, decline or sideways. Have a plan for all three scenarios
BEFORE making the trade. Consider possible holding times. And finally, look at overall market
conditions and sector/industry performance.

About the author:
Arthur Hill, CMT, is the Chief Technical Strategist at TrendInvestorPro.com. Focusing predominantly on US equities and ETFs, his systematic approach of identifying trend, finding signals within the trend, and setting key price levels has made him an esteemed market technician. Arthur has written articles for numerous financial publications including Barrons and Stocks & Commodities Magazine. In addition to his Chartered Market Technician (CMT) designation, he holds an MBA from the Cass Business School at City University in London.
Learn More


