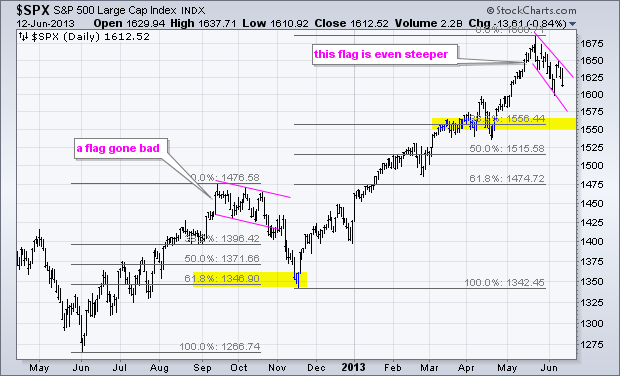
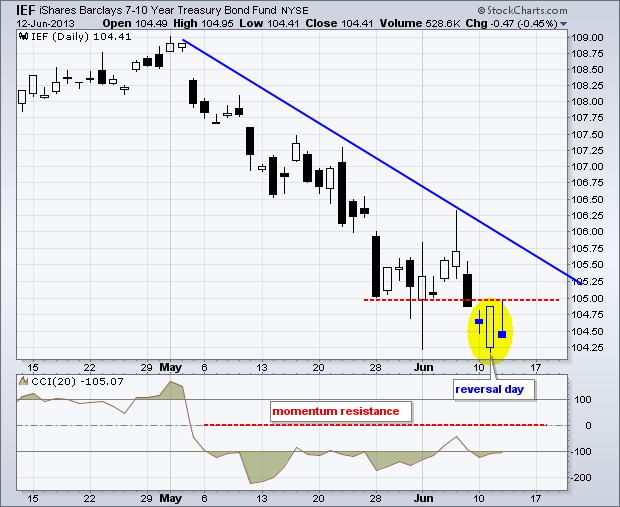
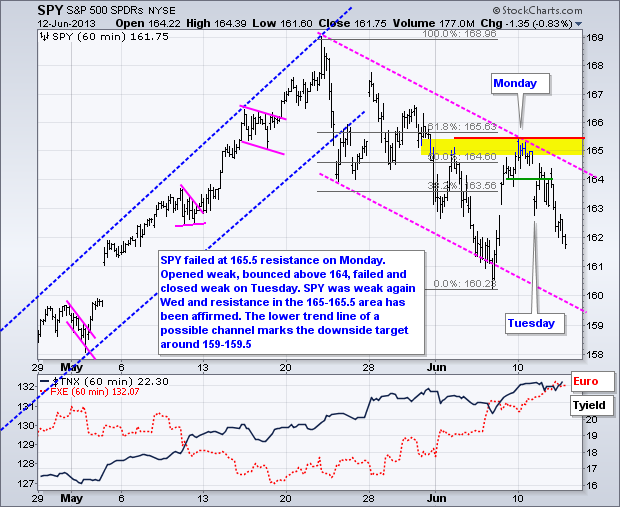
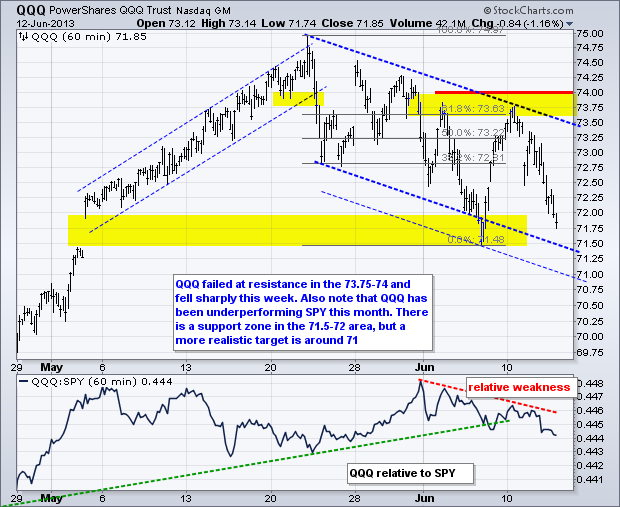
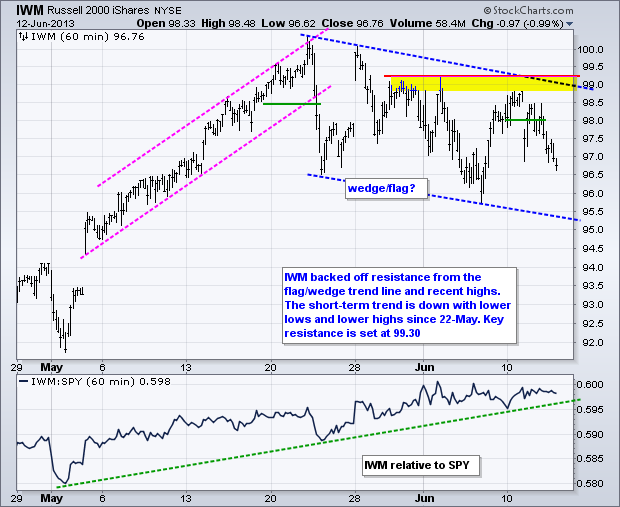
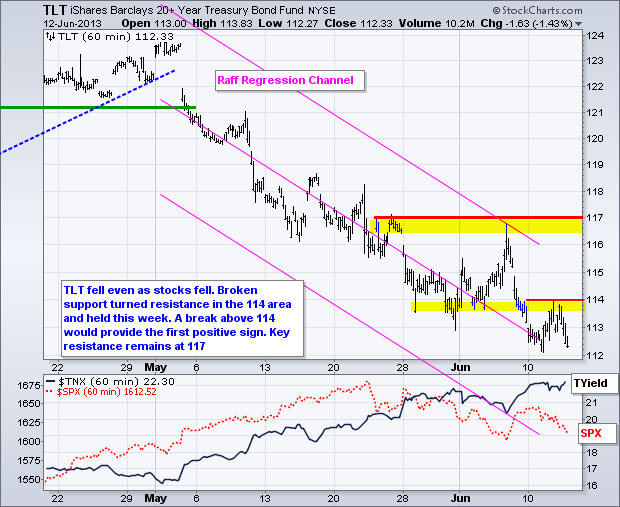
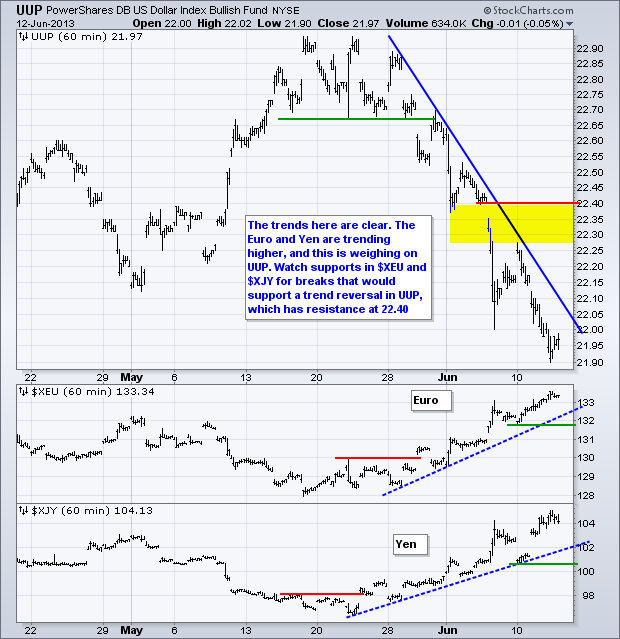
The Asian rout continues as the Shanghai Composite ($SSEC) caught up with a 2.83% decline on Thursday. The Hang Seng Index ($HSI) fell another 2.3% and the Nikkei 225 ($NIKK) plunged over 6%. European stocks are also down with the major indices falling around 1% in early trading (4AM ET). The German DAX Index ($DAX) was down over 1.5%. Perhaps European stocks, and German exporters, are smarting from a rising Euro, which is up almost 4% since mid May. In any case, US stocks are in short-term downtrends and look vulnerable to further weakness. Even though this is still just a correction within a bigger uptrend, the current decline is the deepest since October. The October decline started as a falling flag and evolved into more as the S&P 500 fell over 8%. An 8% decline from recent highs would extend to the 1555 area. Notice that the 38.2% retracement and March-April lows mark support in this area. The second chart below shows the 7-10 year T-Bond ETF (IEF) stalling on Monday, forming a bullish engulfing on Tuesday and an inverted hammer on Wednesday. Treasuries are setting up for a bounce and this would be negative for stocks. A breakout at 105 in IEF and CCI move into positive territory would be short-term bullish here. Retail sales will be reported before the open and a disappointment would likely exacerbate selling pressure.

**************************************************************************
**************************************************************************
**************************************************************************
**************************************************************************
**************************************************************************
Key Reports and Events (all times Eastern):
Thu - Jun 13 - 08:30 - Jobless Claims
Thu - Jun 13 - 08:30 - Retail Sales
Thu - Jun 13 - 10:00 - Business Inventories
Thu - Jun 13 - 10:30 - Natural Gas Inventories
Fri - Jun 14 - 08:30 - Producer Price Index (PPI)
Fri - Jun 14 - 09:15 - Industrial Production
Fri - Jun 14 - 09:55 - Michigan Sentiment
Charts of Interest: Tuesday and Thursday
This commentary and charts-of-interest are designed to stimulate thinking. This analysis is
not a recommendation to buy, sell, hold or sell short any security (stock ETF or otherwise).
We all need to think for ourselves when it comes to trading our own accounts. First, it is
the only way to really learn. Second, we are the only ones responsible for our decisions.
Think of these charts as food for further analysis. Before making a trade, it is important
to have a plan. Plan the trade and trade the plan. Among other things, this includes setting
a trigger level, a target area and a stop-loss level. It is also important to plan for three
possible price movements: advance, decline or sideways. Have a plan for all three scenarios
BEFORE making the trade. Consider possible holding times. And finally, look at overall market
conditions and sector/industry performance.

About the author:
Arthur Hill, CMT, is the Chief Technical Strategist at TrendInvestorPro.com. Focusing predominantly on US equities and ETFs, his systematic approach of identifying trend, finding signals within the trend, and setting key price levels has made him an esteemed market technician. Arthur has written articles for numerous financial publications including Barrons and Stocks & Commodities Magazine. In addition to his Chartered Market Technician (CMT) designation, he holds an MBA from the Cass Business School at City University in London.
Learn More


