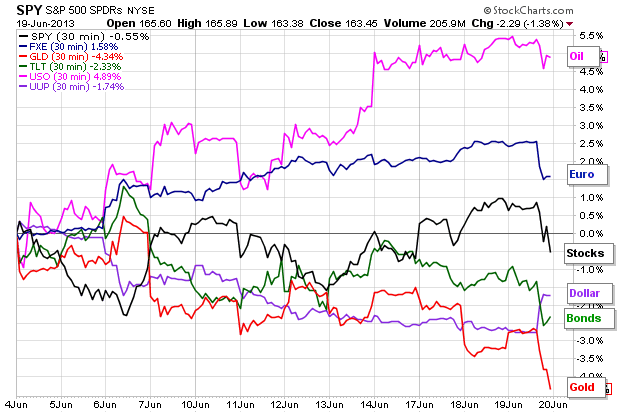
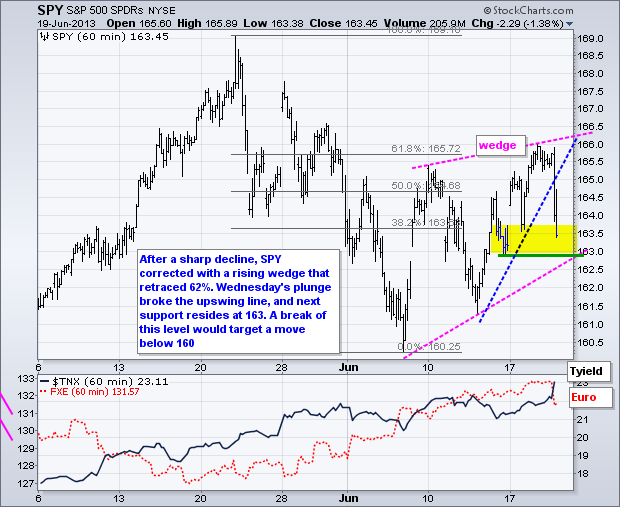
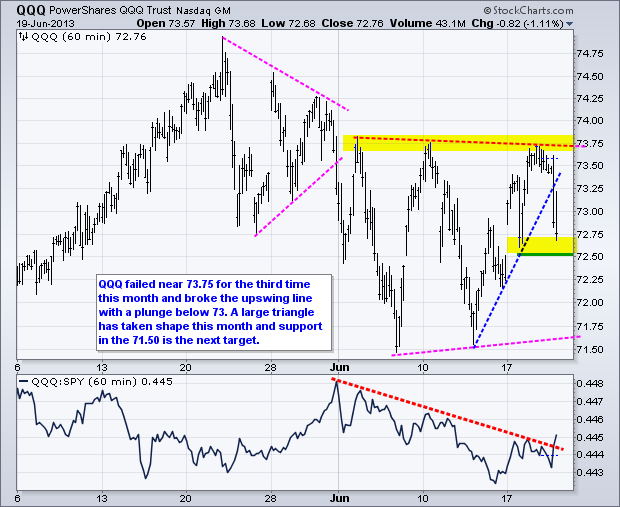
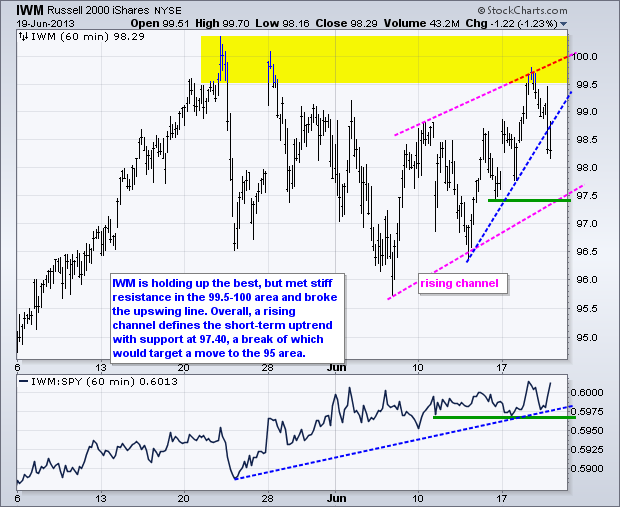
Stocks tried to front run the Fed and got burned when Bernanke stuck to his guns on tapering. The S&P 500 ETF (SPY) was up over 3% in the run up to the Fed meeting and fell 1.38% on Wednesday. The sharp decline in stocks warranted a redraw on the charts and it now looks as if a bearish wedge formed in SPY. Treasuries fell sharply on the Fed news and the 10-year Treasury Yield ($TNX) surged to its highest level in over a year. Stocks are not in the mood for rising interest rates, even if the 10-year yield is simply returning to normalcy (its early 2011 levels). Interest rate sensitive shares were hit especially hard with the Utilities SPDR (XLU), Real Estate iShares (IYR) and Telecom iShares (IYZ) falling 2-3%. The Dollar surged on the prospects of less quantitative easing and higher bond yields. Gold was hit hard again and remains in a downtrend all around. Overall, it looks like the taper trends are reasserting themselves and could remain in place for a few weeks, at least. This means weakness in stocks, rising Treasury yields, a stronger Dollar and weaker gold.

**************************************************************************
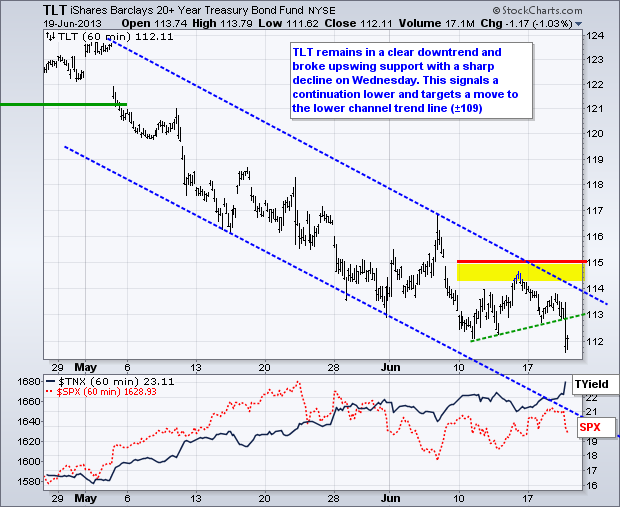
**************************************************************************
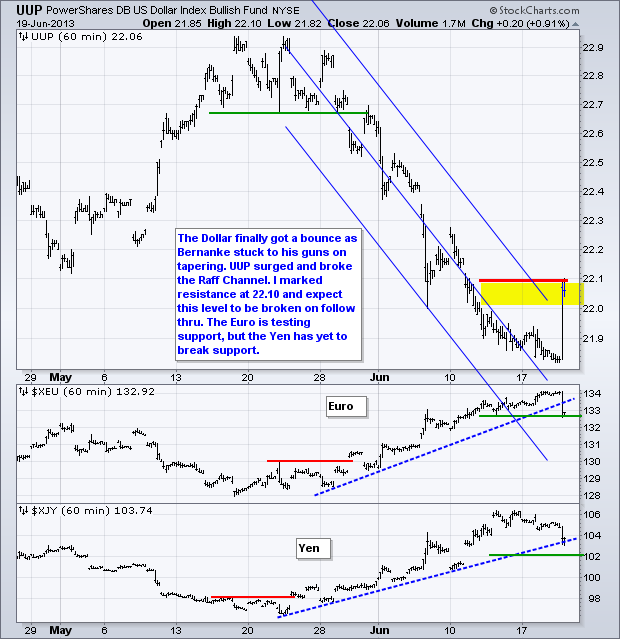
**************************************************************************
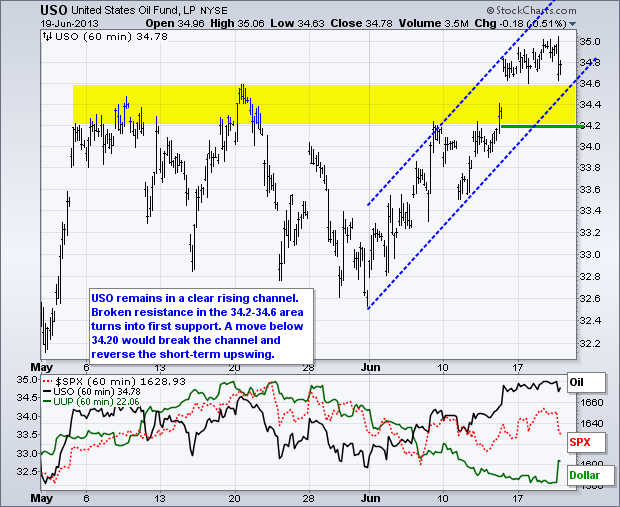
**************************************************************************
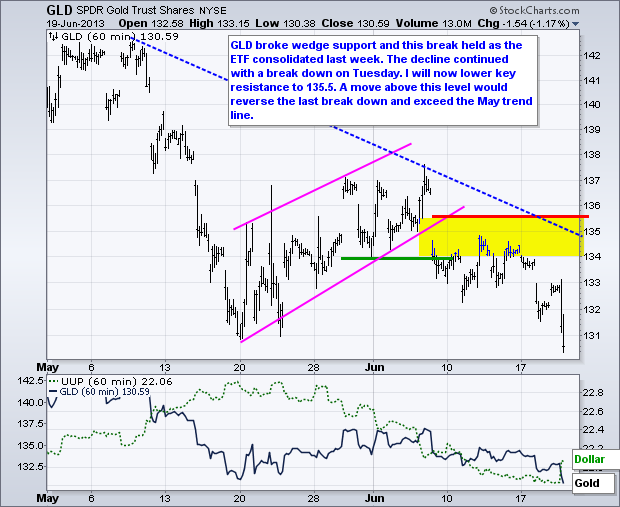
**************************************************************************
Key Reports and Events (all times Eastern):
Thu - Jun 20 - 08:30 - Jobless Claims
Thu - Jun 20 - 10:00 - Existing Home Sales
Thu - Jun 20 - 10:00 - Philadelphia Fed
Thu - Jun 20 - 10:00 - Leading Economic Indicators
Thu - Jun 20 - 10:30 - Natural Gas Inventories
Charts of Interest: Tuesday and Thursday
This commentary and charts-of-interest are designed to stimulate thinking. This analysis is
not a recommendation to buy, sell, hold or sell short any security (stock ETF or otherwise).
We all need to think for ourselves when it comes to trading our own accounts. First, it is
the only way to really learn. Second, we are the only ones responsible for our decisions.
Think of these charts as food for further analysis. Before making a trade, it is important
to have a plan. Plan the trade and trade the plan. Among other things, this includes setting
a trigger level, a target area and a stop-loss level. It is also important to plan for three
possible price movements: advance, decline or sideways. Have a plan for all three scenarios
BEFORE making the trade. Consider possible holding times. And finally, look at overall market
conditions and sector/industry performance.

About the author:
Arthur Hill, CMT, is the Chief Technical Strategist at TrendInvestorPro.com. Focusing predominantly on US equities and ETFs, his systematic approach of identifying trend, finding signals within the trend, and setting key price levels has made him an esteemed market technician. Arthur has written articles for numerous financial publications including Barrons and Stocks & Commodities Magazine. In addition to his Chartered Market Technician (CMT) designation, he holds an MBA from the Cass Business School at City University in London.
Learn More


