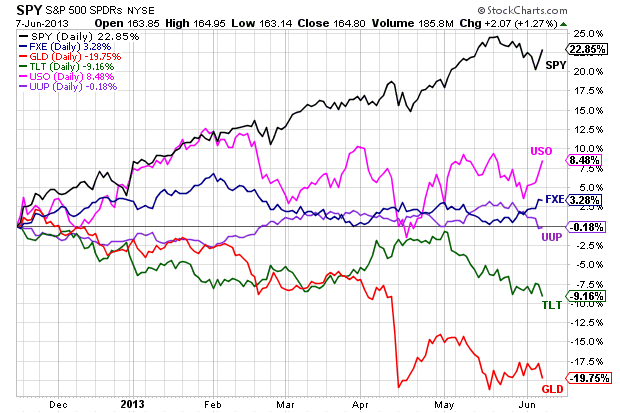
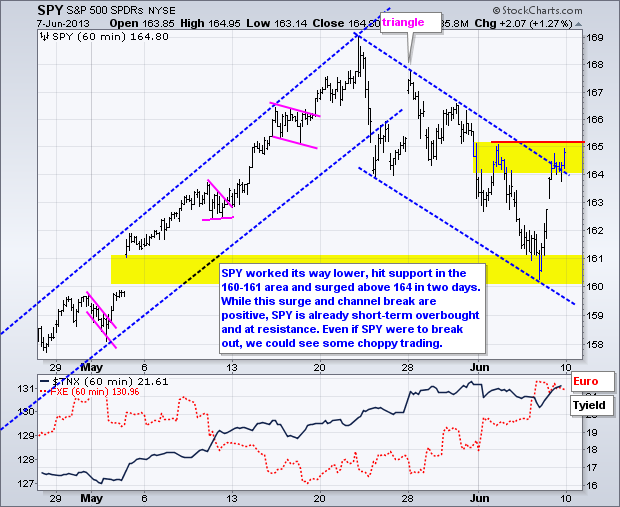
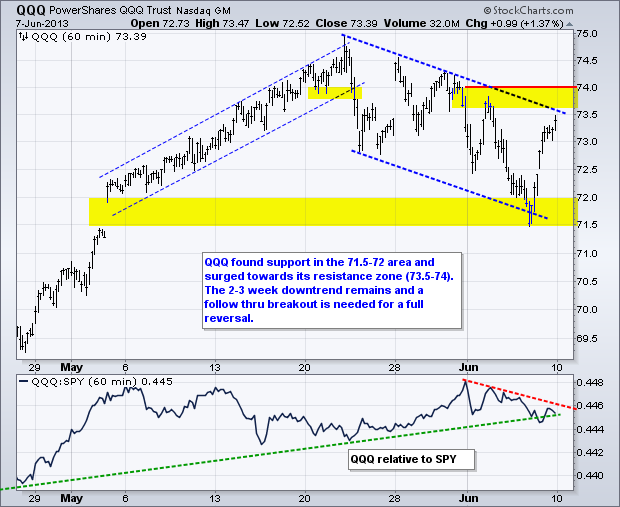
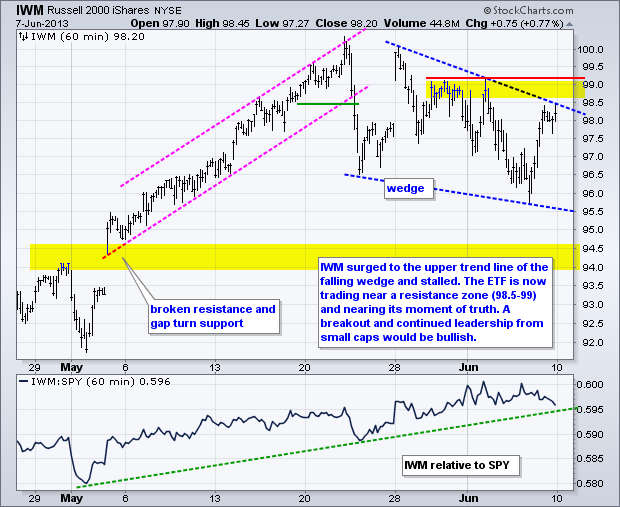
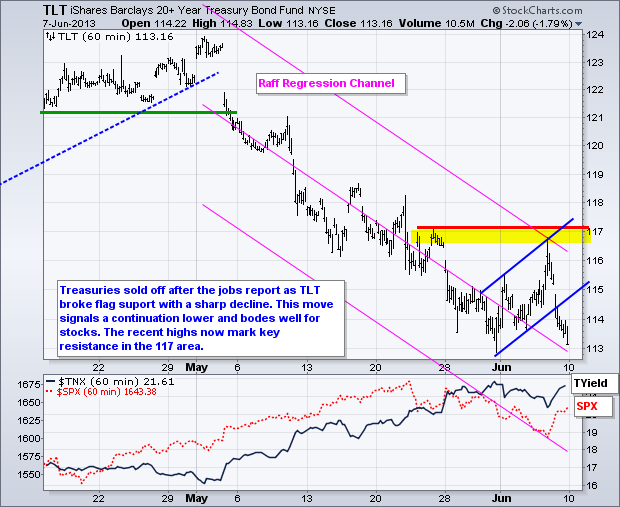
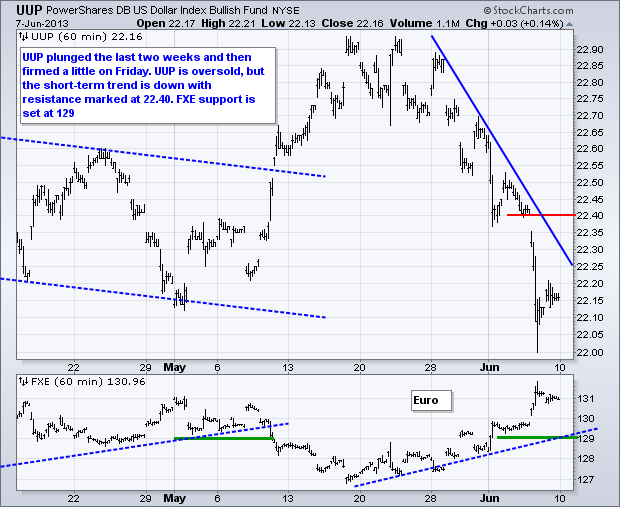
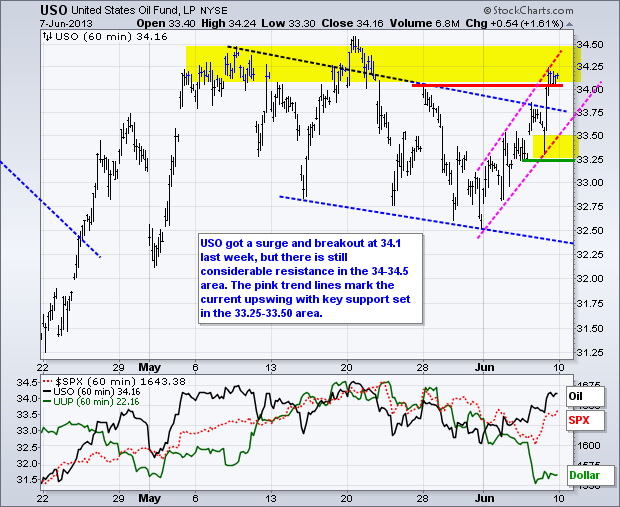
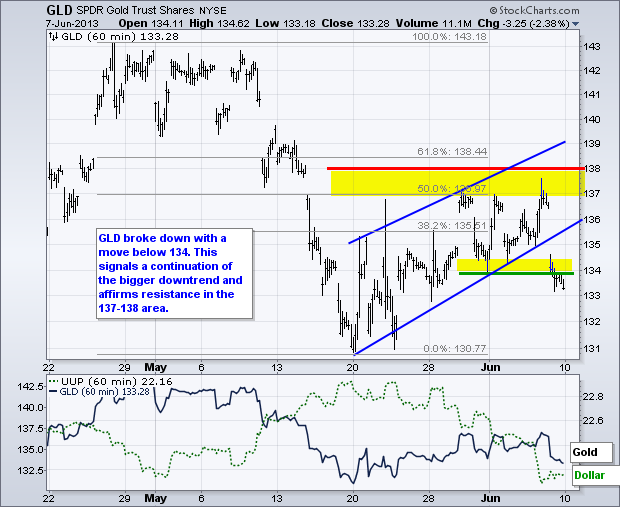
Stocks reacted positively to a rather routine employment report. The Labor department reported a 175,000 increase in non-farm payrolls for May. This is the not-to-hot and not-to-cold version of the jobs report. It is enough to suggest modest economic growth and keep the hopes alive for sustained quantitative easing. Stocks surged with the major index ETFs advancing over 1%. Treasuries plunged with the 20+ Year T-Bond ETF (TLT) falling 1.79% on the day. Overall, stocks fell Monday-Tuesday-Wednesday, and then surged on Thursday-Friday. The net result was positive as the major index ETFs closed with small gains for the week. On the price charts, the major index ETFs remain in 3-4 week consolidations. A little follow through to last week's reversal is needed to break consolidation resistance and signal a continuation higher. The PerfChart below shows stocks (SPY), oil (USO) and the Euro (FXE) leading the way since mid November. Conversely, the Dollar (UUP), Treasuries (TLT) and gold (GLD) are down. These relationships reflect a market that is embracing risk.

**************************************************************************
**************************************************************************
**************************************************************************
**************************************************************************
**************************************************************************
Key Reports and Events (all times Eastern):
Wed - Jun 12 - 07:00 - MBA Mortgage Index
Wed - Jun 12 - 10:30 - Oil Inventories
Thu - Jun 13 - 08:30 - Jobless Claims
Thu - Jun 13 - 08:30 - Retail Sales
Thu - Jun 13 - 10:00 - Business Inventories
Thu - Jun 13 - 10:30 - Natural Gas Inventories
Fri - Jun 14 - 08:30 - Producer Price Index (PPI)
Fri - Jun 14 - 09:15 - Industrial Production
Fri - Jun 14 - 09:55 - Michigan Sentiment
Charts of Interest: Tuesday and Thursday
This commentary and charts-of-interest are designed to stimulate thinking. This analysis is
not a recommendation to buy, sell, hold or sell short any security (stock ETF or otherwise).
We all need to think for ourselves when it comes to trading our own accounts. First, it is
the only way to really learn. Second, we are the only ones responsible for our decisions.
Think of these charts as food for further analysis. Before making a trade, it is important
to have a plan. Plan the trade and trade the plan. Among other things, this includes setting
a trigger level, a target area and a stop-loss level. It is also important to plan for three
possible price movements: advance, decline or sideways. Have a plan for all three scenarios
BEFORE making the trade. Consider possible holding times. And finally, look at overall market
conditions and sector/industry performance.

About the author:
Arthur Hill, CMT, is the Chief Technical Strategist at TrendInvestorPro.com. Focusing predominantly on US equities and ETFs, his systematic approach of identifying trend, finding signals within the trend, and setting key price levels has made him an esteemed market technician. Arthur has written articles for numerous financial publications including Barrons and Stocks & Commodities Magazine. In addition to his Chartered Market Technician (CMT) designation, he holds an MBA from the Cass Business School at City University in London.
Learn More


