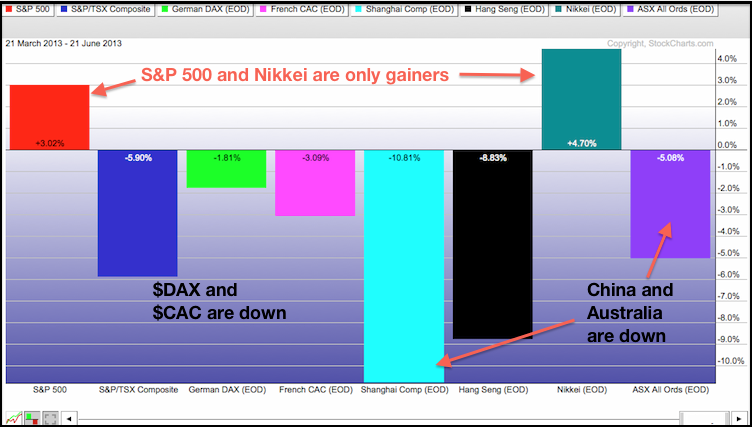
Chinese equities were hit hard on Monday with the Hang Seng Index ($HSI) falling over 2% and the Shanghai Composite ($SSEC) plunging over 5%. A surge in overnight repo rates (Chibor) is to blame. Note that the US experienced a similar rate surge just before the Lehman collapse. While I am not calling for a collapse in China, there is clearly a credit squeeze underway and this will further pressure the markets. European stocks were mixed in early trading, while US stock futures were trading modestly lower. The PerfChart below shows two North American indices, two European indices and four Asia indices. The S&P 500 and the Nikkei 225 are the only two indices showing gains over the last three months. The Shanghai Composite ($SSEC) is down over 15% because Monday's 5% decline is not factored into this chart. Even though selling pressure may not surge, we could see an absence of buying pressure and this could weigh on US stocks in the coming weeks. The S&P 500 is in corrective mode as weekly MACD moved below its signal line for the first time in 2013.
**************************************************************************
**************************************************************************
**************************************************************************
**************************************************************************
**************************************************************************
Key Reports and Events (all times Eastern):
Tue - Jun 25 - 08:30 - Durable Orders
Tue - Jun 25 - 09:00 - Case-Shiller 20-city Index
Tue - Jun 25 - 09:00 - FHFA Housing Price Index
Tue - Jun 25 - 10:00 - Consumer Confidence
Tue - Jun 25 - 10:00 - New Home Sales
Wed - Jun 26 - 07:00 - MBA Mortgage Index
Wed - Jun 26 - 08:30 - GDP - Third Estimate
Wed - Jun 26 - 10:30 - Crude Inventories
Thu - Jun 27 - 08:30 - Initial Claims
Thu - Jun 27 - 08:30 - Personal&Spending
Thu - Jun 27 - 10:00 - Pending Home Sales
Thu - Jun 27 - 10:30 - Natural Gas Inventories
Fri - Jun 28 - 09:45 - Chicago PMI
Charts of Interest: Tuesday and Thursday
This commentary and charts-of-interest are designed to stimulate thinking. This analysis is
not a recommendation to buy, sell, hold or sell short any security (stock ETF or otherwise).
We all need to think for ourselves when it comes to trading our own accounts. First, it is
the only way to really learn. Second, we are the only ones responsible for our decisions.
Think of these charts as food for further analysis. Before making a trade, it is important
to have a plan. Plan the trade and trade the plan. Among other things, this includes setting
a trigger level, a target area and a stop-loss level. It is also important to plan for three
possible price movements: advance, decline or sideways. Have a plan for all three scenarios
BEFORE making the trade. Consider possible holding times. And finally, look at overall market
conditions and sector/industry performance.

