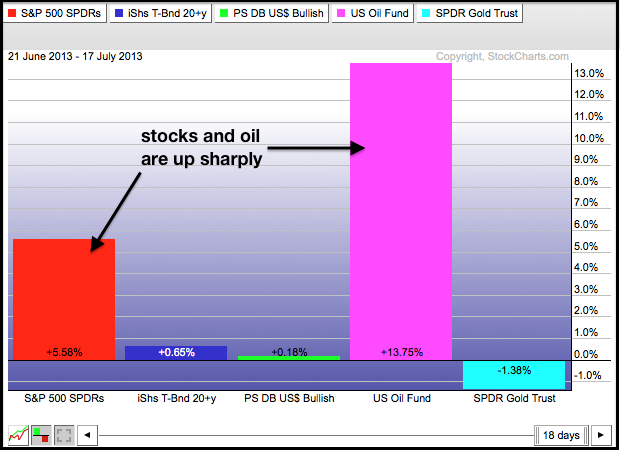
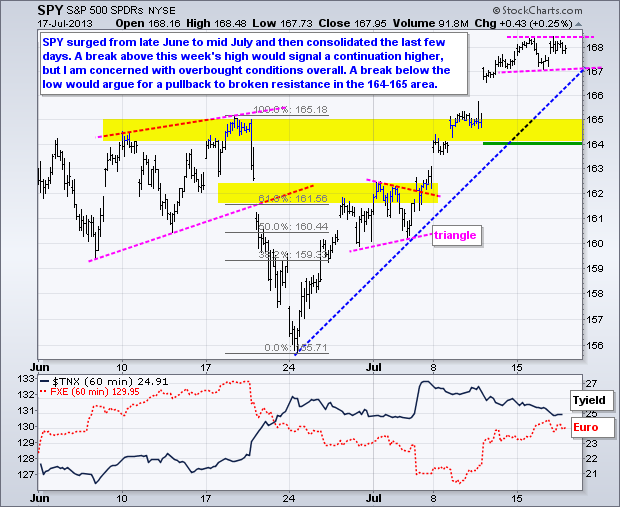
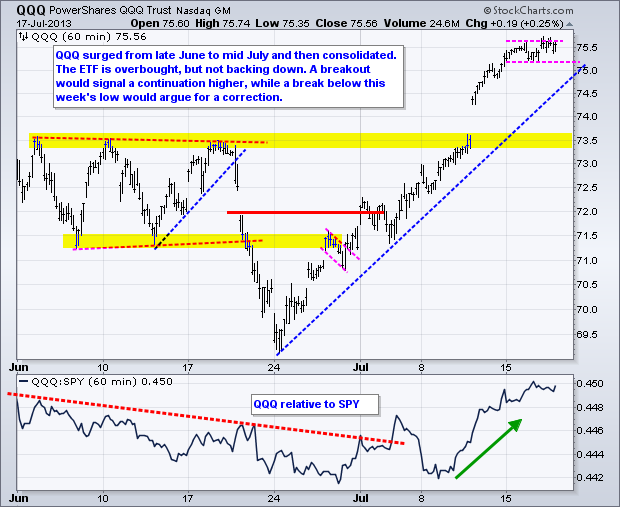
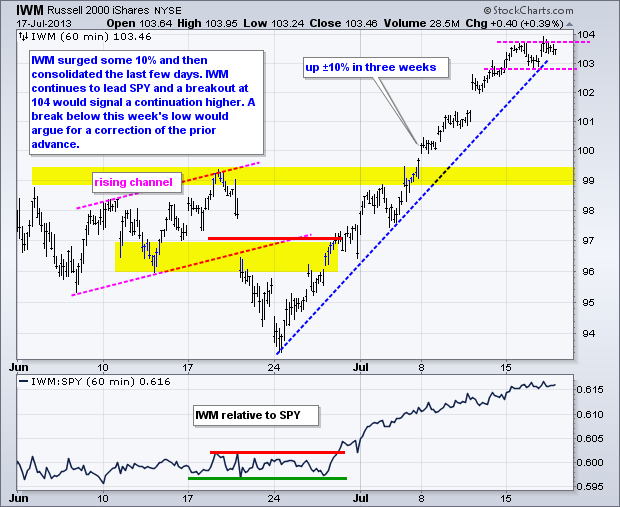
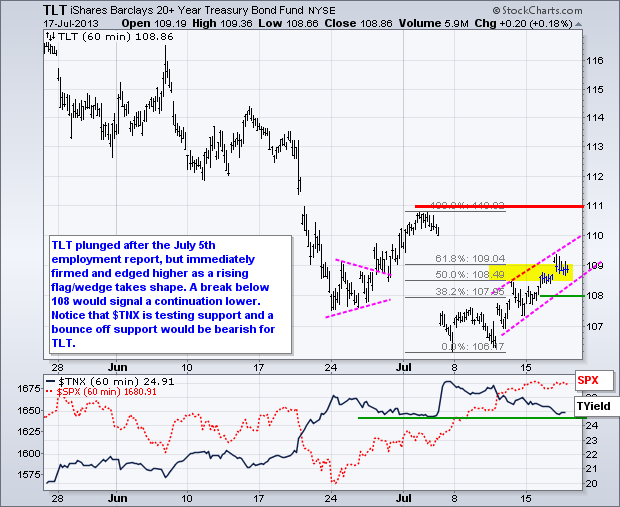
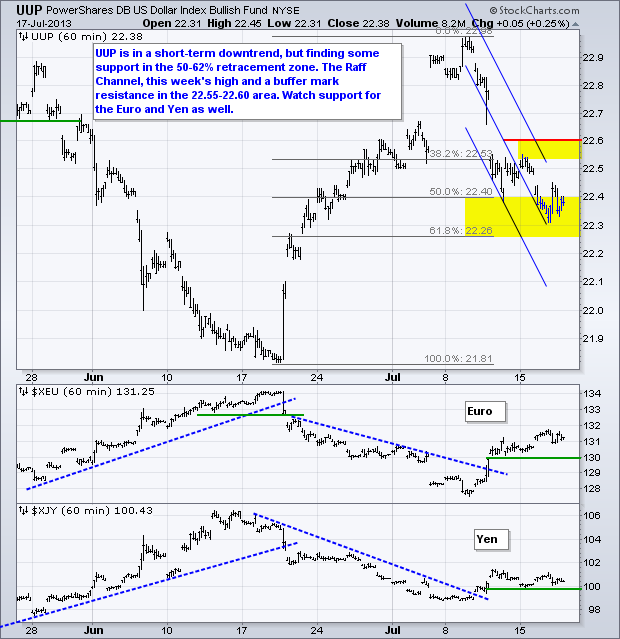
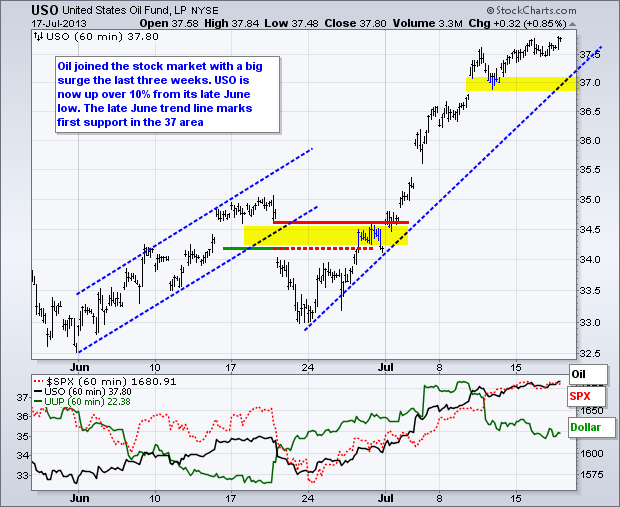
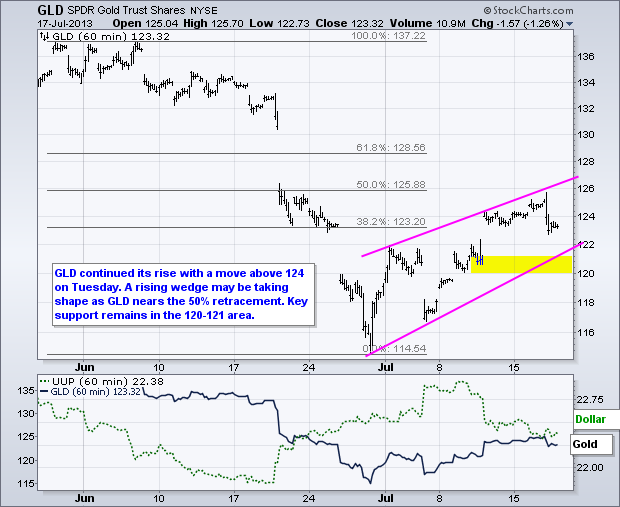
Earnings season is turning rather mixed with financials showing strong results and techs more mixed. Morgan Stanley is the latest big financial player to report strong results. Intel, on the other hand, reported weak results with its fourth straight quarterly decline in revenues. Google and Microsoft on are on deck today after the close. Chairman Bernanke finishes his testimony today. As he has stated all along, the future of quantitative easing depends on the economic data. The Fed has the option to increase or decrease quantitative easing as it sees fit. Forget about the rhetoric and watch the tape for clues. After big moves from late June to mid July, stocks consolidated the last few days with the major index ETFs trading flat. This is one way to work off overbought conditions. Even though breakouts would be short-term bullish, the chances of whipsaw look high because the major index ETFs are still ripe for a corrective period. The PerfChart below shows that SPY and USO are up sharply the last 18 days. Note that both the US Dollar Fund (UUP) and the 20+ Year T-Bond ETF (TLT) are also up, but just a wee bit. The Gold SPDR (GLD) remains the loser on this intermarket chart.

**************************************************************************
**************************************************************************
**************************************************************************
**************************************************************************
**************************************************************************
Key Reports and Events (all times Eastern):
Thu - Jul 18 - 08:30 - Jobless Claims
Thu - Jul 18 - 10:00 – Chairman Bernanke Testifies before Congress
Thu - Jul 18 - 10:00 - Philadelphia Fed
Thu - Jul 18 - 10:00 - Leading Economic Indicators
Thu - Jul 18 - 10:30 - Natural Gas Inventories
Fri - Jul 19 - 10:00 – Happy Friday!
Charts of Interest: Tuesday and Thursday
This commentary and charts-of-interest are designed to stimulate thinking. This analysis is
not a recommendation to buy, sell, hold or sell short any security (stock ETF or otherwise).
We all need to think for ourselves when it comes to trading our own accounts. First, it is
the only way to really learn. Second, we are the only ones responsible for our decisions.
Think of these charts as food for further analysis. Before making a trade, it is important
to have a plan. Plan the trade and trade the plan. Among other things, this includes setting
a trigger level, a target area and a stop-loss level. It is also important to plan for three
possible price movements: advance, decline or sideways. Have a plan for all three scenarios
BEFORE making the trade. Consider possible holding times. And finally, look at overall market
conditions and sector/industry performance.

About the author:
Arthur Hill, CMT, is the Chief Technical Strategist at TrendInvestorPro.com. Focusing predominantly on US equities and ETFs, his systematic approach of identifying trend, finding signals within the trend, and setting key price levels has made him an esteemed market technician. Arthur has written articles for numerous financial publications including Barrons and Stocks & Commodities Magazine. In addition to his Chartered Market Technician (CMT) designation, he holds an MBA from the Cass Business School at City University in London.
Learn More


