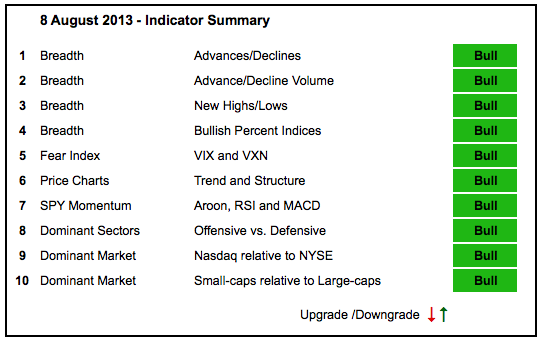
Stocks stalled over the last two weeks, but this was not enough to derail any indicators or the overall uptrend in the major index ETFs. Note that the major index ETFs hit new highs over the last two weeks, while XLK, XLY and XLI hit new highs to lead the sectors. The NYSE is clearly not as strong as the Nasdaq though. Note that the NYSE AD Line did not clear its May high and Net New Highs actually dipped into negative territory for a few days this week.


- AD Lines: Bullish. The Nasdaq AD Line hit a new high in July and then stalled over the last few weeks. The NYSE AD Line hit resistance from its May high and pulled back over the last two weeks. Both remain in uptrends overall.
- AD Volume Lines: Bullish. The Nasdaq AD Volume Line hit a new high in early August. The NYSE AD Volume Line hit a new high in late July.
- Net New Highs: Bullish. NYSE Net New Highs show much less strength than Nasdaq Net New Highs. Their cumulative lines, however, remain in clear uptrends with new highs this week.
- Bullish Percent Indices: Bullish. All nine sector Bullish Percent Indices are above 50%.
- VIX/VXN: Bullish. The S&P 500 Volatility Index ($VIX) and the Nasdaq 100 Volatility Index ($VXN) are trading near their 2013 lows, which creates a bullish environment.
- Trend-Structure: Bullish. DIA, IWM, MDY, QQEW and SPY all hit new 52-week highs over the last few weeks.
- SPY Momentum: Bullish. RSI remains above 60, MACD (5,35,5) is in positive territory and the Aroon Oscillator is above +50.
- Offensive Sector Performance: Bullish. The Consumer Discretionary SPDR (XLY), Technology SPDR (XLK) and Industrials SPDR (XLI) hit new highs in early August. The Finance SPDR (XLF) peaked in late July and shows some relative weakness.
- Nasdaq Performance: Bullish. The $COMPQ:$NYA ratio broke out in early May and remains in an uptrend as the Nasdaq outperforms the NY Composite.
- Small-cap Performance: Bullish. The $RUT:$OEX ratio stalled the last few weeks, but remains in an uptrend since the early May breakout.
- Breadth Charts (here) and Inter-market charts (here) have been updated.

About the author:
Arthur Hill, CMT, is the Chief Technical Strategist at TrendInvestorPro.com. Focusing predominantly on US equities and ETFs, his systematic approach of identifying trend, finding signals within the trend, and setting key price levels has made him an esteemed market technician. Arthur has written articles for numerous financial publications including Barrons and Stocks & Commodities Magazine. In addition to his Chartered Market Technician (CMT) designation, he holds an MBA from the Cass Business School at City University in London.
Learn More


