**This chart analysis is for educational purposes only, and should not
be construed as a recommendation to buy, sell or sell-short said securities**
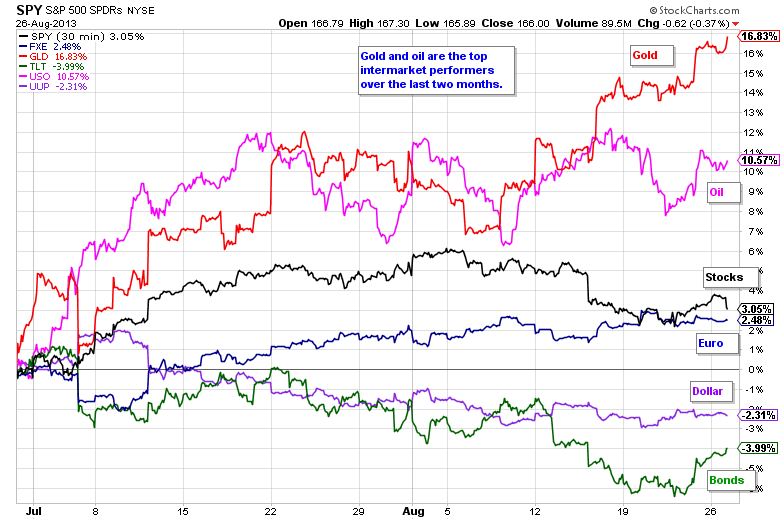
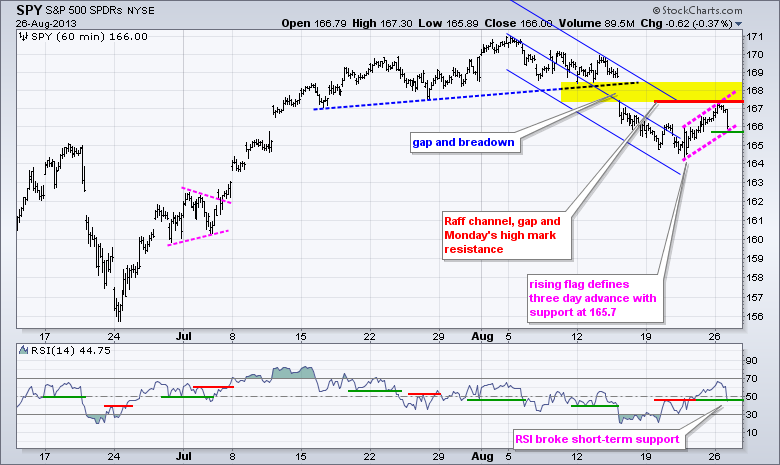
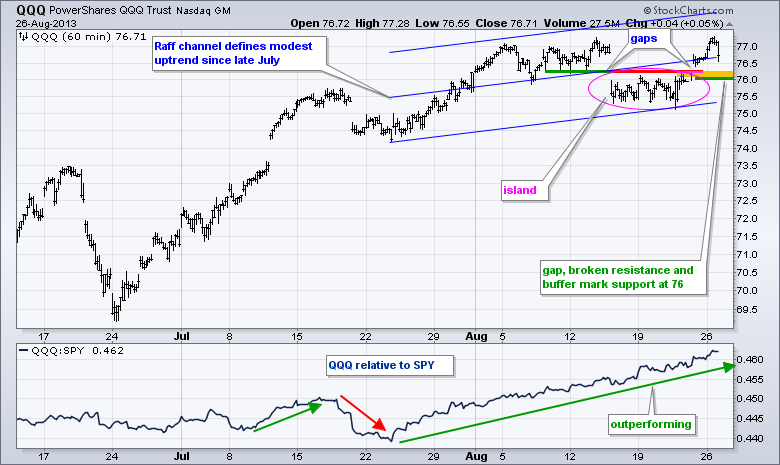
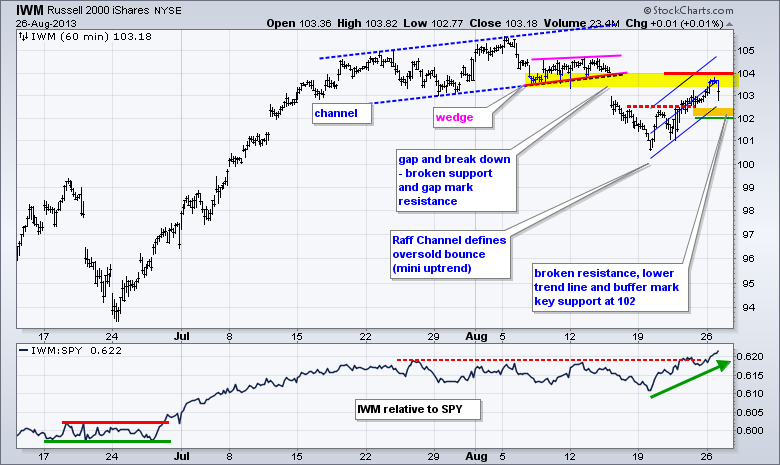
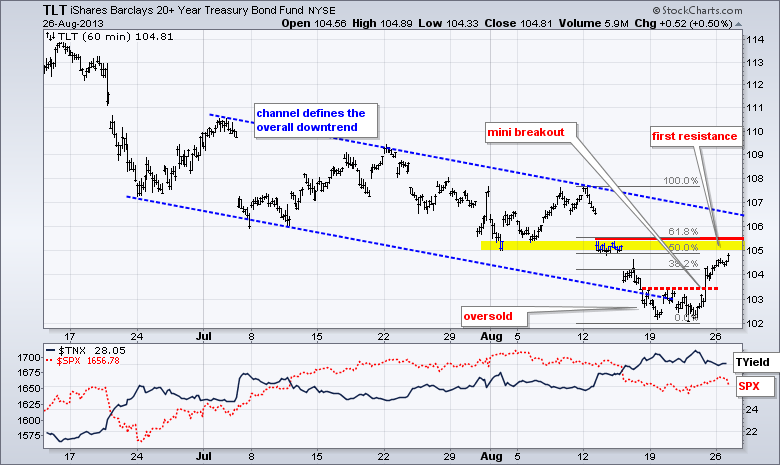
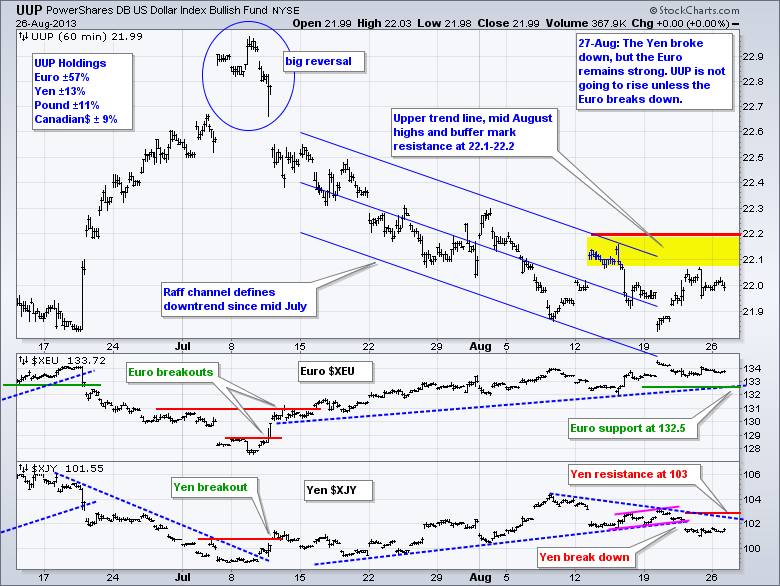
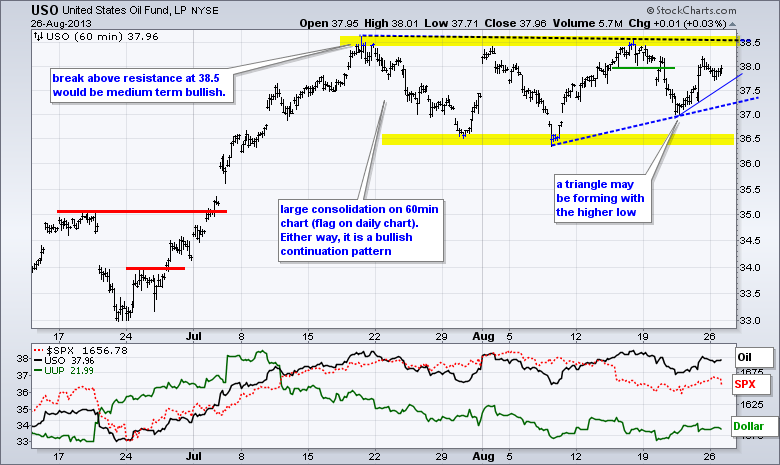
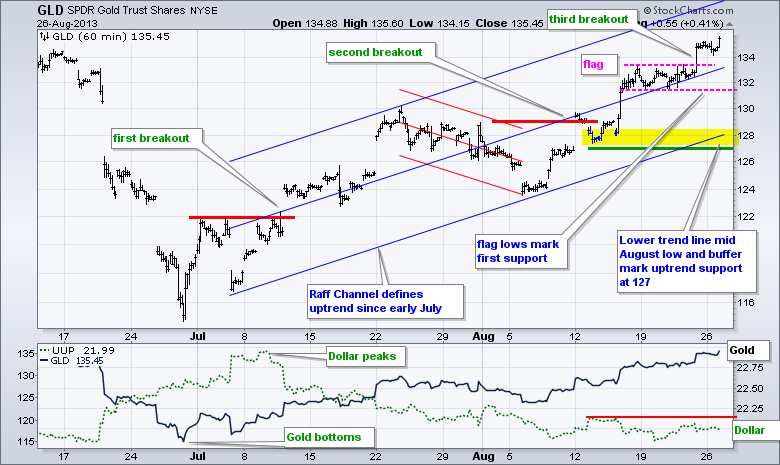
Despite a worse-than-expected durable goods report, stocks opened firmed and advanced in early trading. The major index ETFs were in positive territory in the afternoon, but selling pressure hit in the final hour and erased most of these gains. John Kerry got the blame because the selloff coincided with his statement on Syria. Volatile situations in both Syria and Egypt could keep stock buyers on the sidelines and boost the price of oil. Something is going on in the commodity markets because the US Oil Fund (USO) and Gold SPDR (GLD) are the top performing intermarket assets over the last two months. The US Dollar Fund (UUP) and 20+ Year T-Bond ETF (TLT) are the worst performing. The S&P 500 ETF (SPY) and Euro Currency Trust (FXE) are somewhere in the middle. There is a lot of uncertainty as we head into September-October. In addition to Syria and Egypt, we have tapering talk, a Fed chairman appointment, mixed economic data, the debt-ceiling deadline in mid October and the end of the bearish six month cycle on October 31st. These may be enough to curtail buying pressure and create a vacuum under the stock market. Note that today's commentary features bigger charts with more perspective.

**************************************************************************
**************************************************************************
**************************************************************************
**************************************************************************
**************************************************************************
Key Reports and Events (all times Eastern):
Tue - Aug 27 - 09:00 - Case-Shiller 20-city Index
Tue - Aug 27 - 10:00 - Consumer Confidence
Wed - Aug 28 - 07:00 - MBA Mortgage Index
Wed - Aug 28 - 10:00 - Pending Home Sales
Wed - Aug 28 - 10:30 - Crude Oil Inventories
Thu - Aug 29 - 08:30 - Initial Jobless Claims
Thu - Aug 29 - 08:30 - GDP
Thu - Aug 29 - 10:30 - Natural Gas Inventories
Fri - Aug 30 - 08:30 - Personal Income & Spending
Fri - Aug 30 - 09:45 - Chicago PMI
Fri - Aug 30 - 09:55 - Michigan Sentiment
Charts of Interest: Tuesday and Thursday
This commentary and charts-of-interest are designed to stimulate thinking. This analysis is
not a recommendation to buy, sell, hold or sell short any security (stock ETF or otherwise).
We all need to think for ourselves when it comes to trading our own accounts. First, it is
the only way to really learn. Second, we are the only ones responsible for our decisions.
Think of these charts as food for further analysis. Before making a trade, it is important
to have a plan. Plan the trade and trade the plan. Among other things, this includes setting
a trigger level, a target area and a stop-loss level. It is also important to plan for three
possible price movements: advance, decline or sideways. Have a plan for all three scenarios
BEFORE making the trade. Consider possible holding times. And finally, look at overall market
conditions and sector/industry performance.

About the author:
Arthur Hill, CMT, is the Chief Technical Strategist at TrendInvestorPro.com. Focusing predominantly on US equities and ETFs, his systematic approach of identifying trend, finding signals within the trend, and setting key price levels has made him an esteemed market technician. Arthur has written articles for numerous financial publications including Barrons and Stocks & Commodities Magazine. In addition to his Chartered Market Technician (CMT) designation, he holds an MBA from the Cass Business School at City University in London.
Learn More


