**This chart analysis is for educational purposes only, and should not
be construed as a recommendation to buy, sell or sell-short said securities**
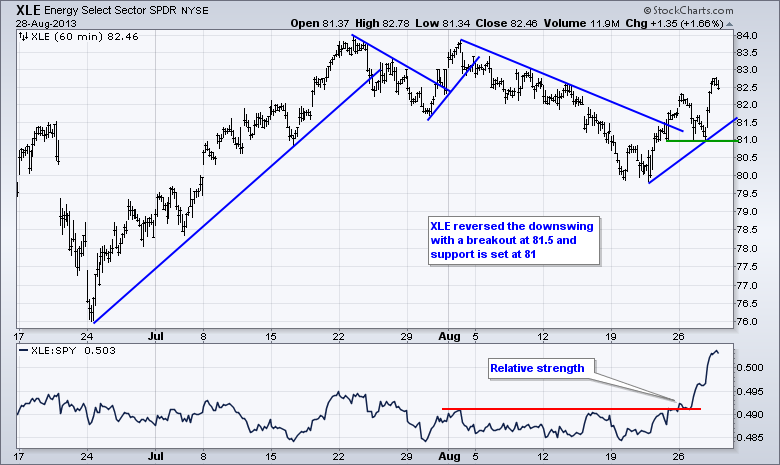
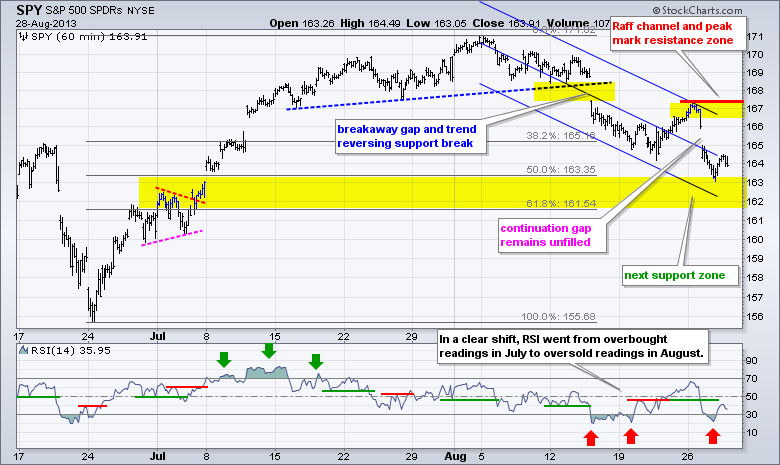
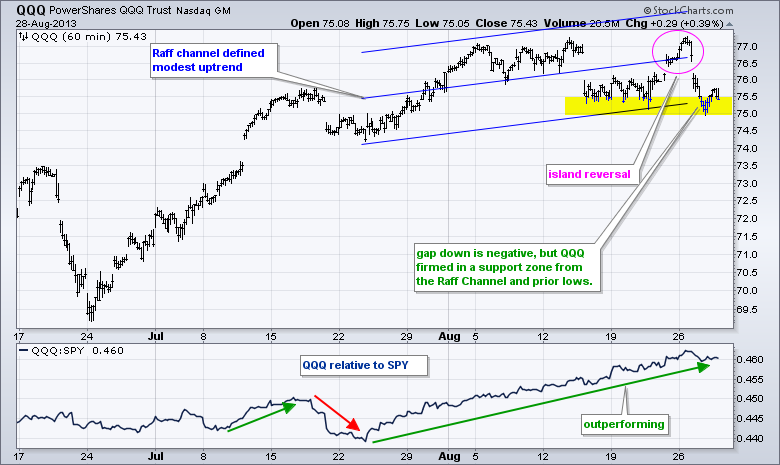
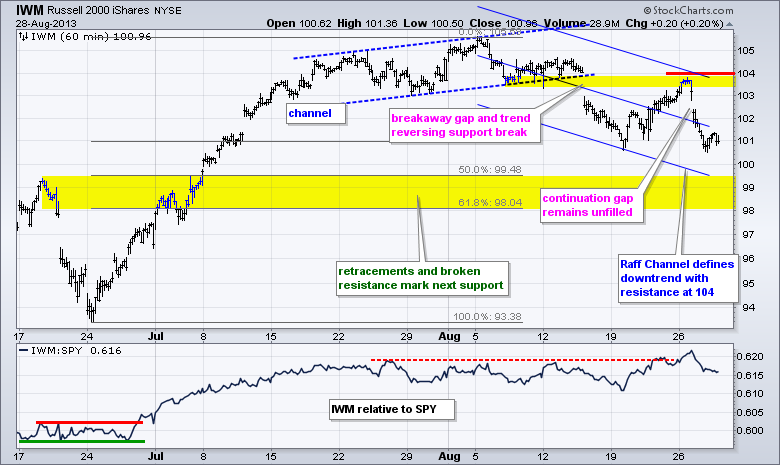
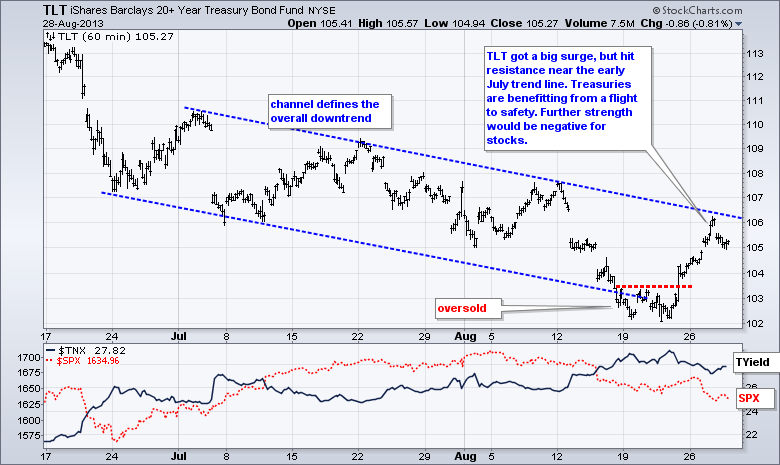
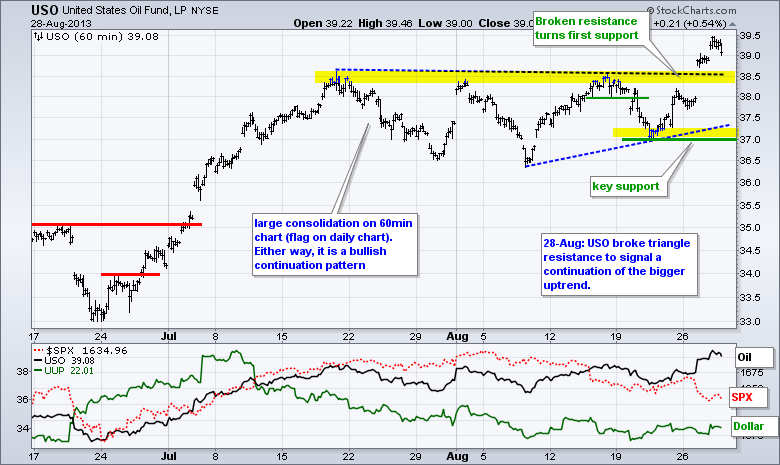
Stocks got an oversold bounce on Wednesday, but the short-term trends remain down and this correction is likely to extent. The Nasdaq 100 ETF (QQQ) led the major index ETFs with a .73% gain. Semis were the standout performers with the Semiconductor SPDR (XSD) gaining over 1.83% on the day. Eight of the nine sectors were up with the Energy SPDR (XLE) surging almost 2%. The remaining sectors gained less than .70%, which was not impressive. Energy-related stocks are benefitting from strength in Spot Light Crude ($WTIC) and Brent. WTI is trading near $109 and challenging its 2012 highs. Brent is trading near $117 after surging over $5 the last two days. Rising gas prices are not going to help a weakening retail environment. Retailers were already on shaky ground after warnings from Aeropostale (ARO), American Eaqle (AEO) and Abercrombie & Fitch (ANF). In addition, Macy's (M) guided lower two weeks ago and William Sonoma (WSM) guided lower on Wednesday. We are seeing continued weakness in homebuilders and housing indicators. The pending home sales index fell 1.3% in July as rising interest rates curtailed buying interest. The Home Construction iShares (ITB) is down around 3% the last two days and the neckline support break is holding. Overall, we have weakness in retail and housing combined with a lot of uncertainty over the next few weeks. We will likely see a military strike against Syria next week, the August employment report is next Friday, a new Fed chairman will likely be appointed in September and the tapering question lingers. This is enough to keep buyers on the sidelines and downward pressure on stocks.

**************************************************************************
**************************************************************************
**************************************************************************
**************************************************************************
**************************************************************************
Key Reports and Events (all times Eastern):
Thu - Aug 29 - 08:30 - Initial Jobless Claims
Thu - Aug 29 - 08:30 - GDP
Thu - Aug 29 - 10:30 - Natural Gas Inventories
Fri - Aug 30 - 08:30 - Personal Income & Spending
Fri - Aug 30 - 09:45 - Chicago PMI
Fri - Aug 30 - 09:55 - Michigan Sentiment
Fri – Sep 06 – 08:30 – Employment Report
Sun – Sep 22 – 10:00 – German Elections
Tue – Oct 15 - 09:00 – Debt Ceiling Deadline
Charts of Interest: Tuesday and Thursday
This commentary and charts-of-interest are designed to stimulate thinking. This analysis is
not a recommendation to buy, sell, hold or sell short any security (stock ETF or otherwise).
We all need to think for ourselves when it comes to trading our own accounts. First, it is
the only way to really learn. Second, we are the only ones responsible for our decisions.
Think of these charts as food for further analysis. Before making a trade, it is important
to have a plan. Plan the trade and trade the plan. Among other things, this includes setting
a trigger level, a target area and a stop-loss level. It is also important to plan for three
possible price movements: advance, decline or sideways. Have a plan for all three scenarios
BEFORE making the trade. Consider possible holding times. And finally, look at overall market
conditions and sector/industry performance.

About the author:
Arthur Hill, CMT, is the Chief Technical Strategist at TrendInvestorPro.com. Focusing predominantly on US equities and ETFs, his systematic approach of identifying trend, finding signals within the trend, and setting key price levels has made him an esteemed market technician. Arthur has written articles for numerous financial publications including Barrons and Stocks & Commodities Magazine. In addition to his Chartered Market Technician (CMT) designation, he holds an MBA from the Cass Business School at City University in London.
Learn More


