**This chart analysis is for educational purposes only, and should not
be construed as a recommendation to buy, sell or sell-short said securities**
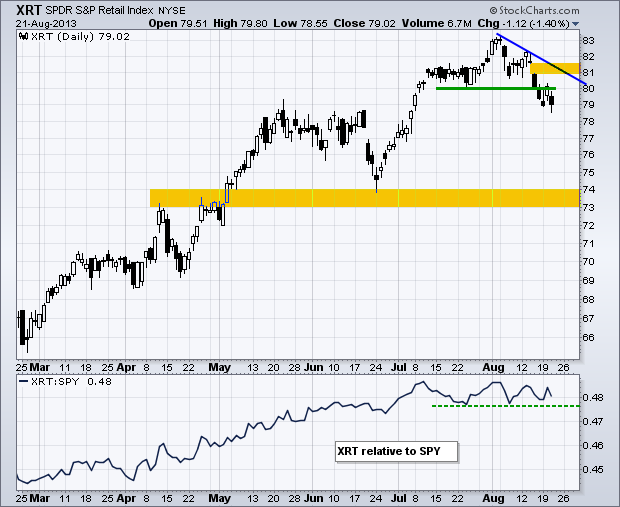
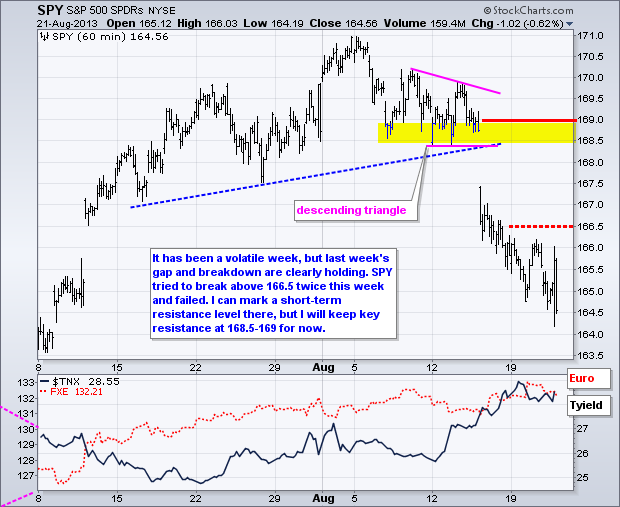
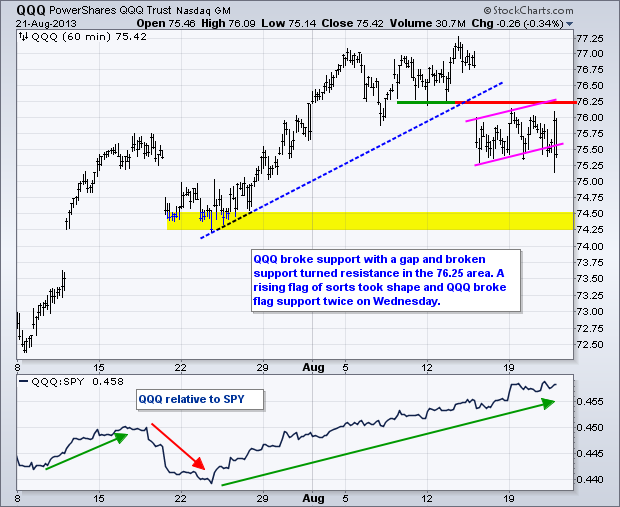
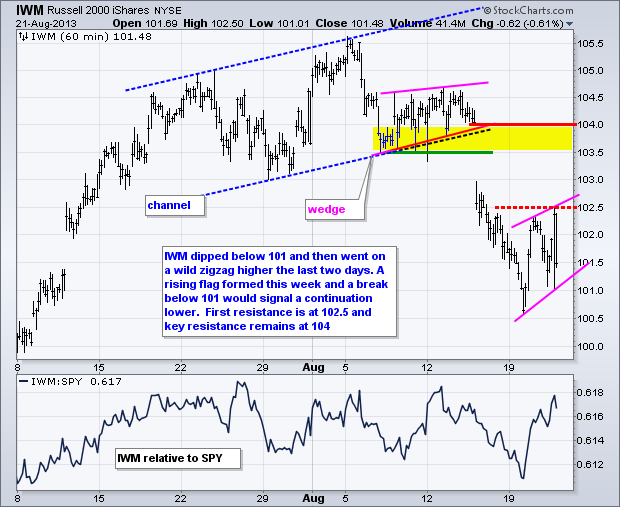
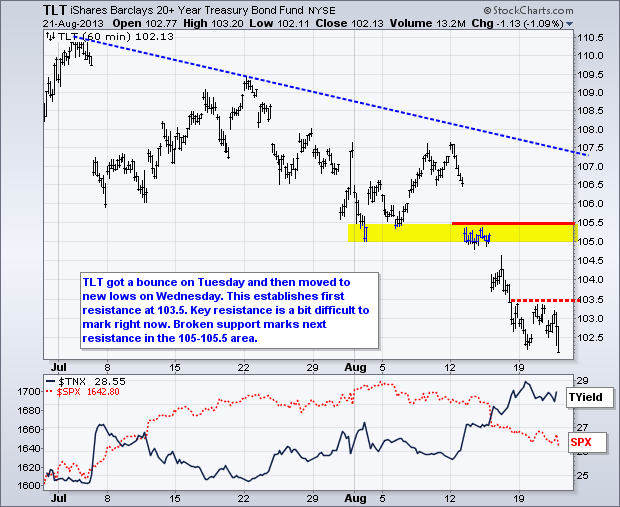
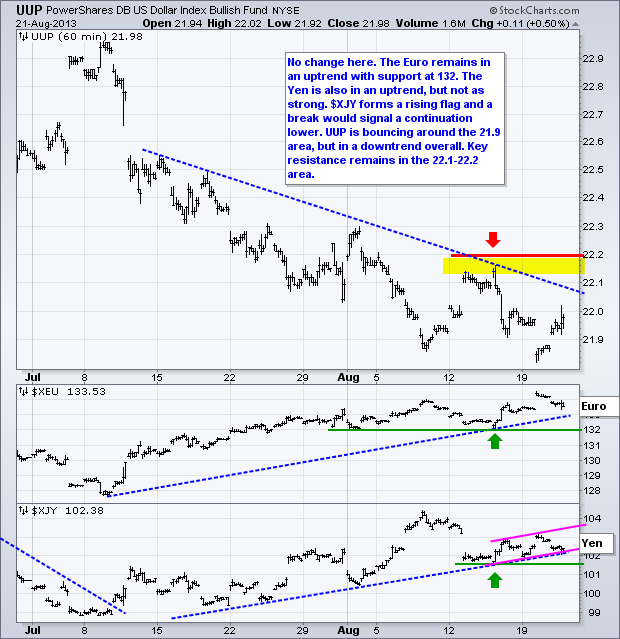
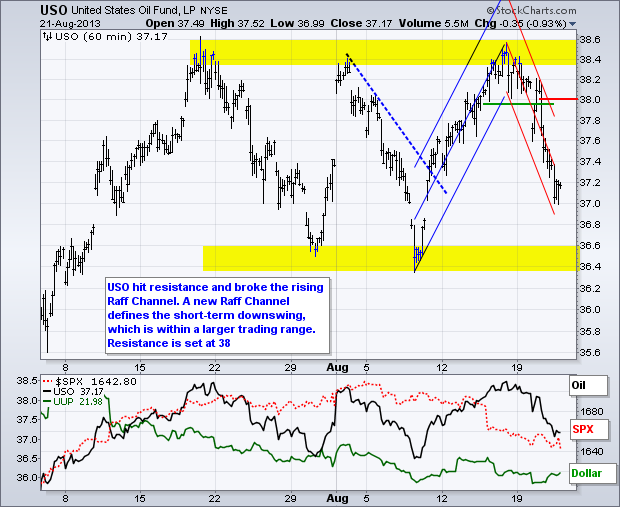
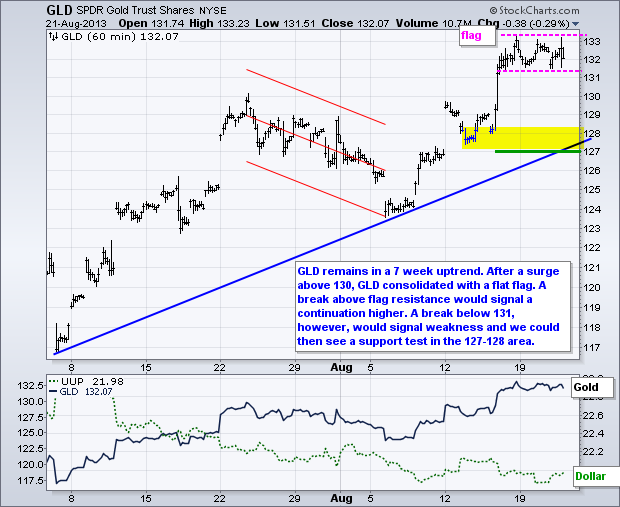
Stocks went on a wild afternoon run as the Fed minutes hit the tape. Despite a bounce attempt, the major index ETFs sold off and ultimately closed lower to affirm their short-term downtrends. SPY plunged below 164.2 just after 2PM, surged above 166 just before 3PM and then fell below 164.6 by the close. SPY volume was high from 2PM until the close. Basically, the post-Fed rally attempt failed and the major index ETFs established minor resistance levels with this week's highs. I am not sure why the market moved like it did because there was nothing new from the Fed minutes. Most Fed members favor tapering AS LONG AS the economy continues to improve. In other words, Fed actions remain data dependent. I would be more concerned with the continuing troubles in retail. Aeropostale and American Eagle first warned in early August and got hammered the last few weeks. Macy's disappointed last week, gapped down and broke its June low. Wal-mart also missed last week and gapped down. Target joined the fray with a miss on Wednesday and gap below the May-June lows. L-Brands (LTD), formerly Limited Brands, provided weak guidance and got hit afterhours. The chart below shows the Retail SPDR (XRT) gapping down and breaking short-term support at 80. Even though the long-term trend remains up, the short-term trend is down and this correction could extend to the mid 70s.
**************************************************************************
**************************************************************************
**************************************************************************
**************************************************************************
**************************************************************************
Key Reports and Events (all times Eastern):
Thu - Aug 22 - 08:30 - Initial Claims
Thu - Aug 22 - 10:00 - Leading Indicators
Thu - Aug 22 - 10:30 - Natural Gas Inventories
Fri - Aug 23 - 10:00 - New Home Sales
Charts of Interest: Tuesday and Thursday
This commentary and charts-of-interest are designed to stimulate thinking. This analysis is
not a recommendation to buy, sell, hold or sell short any security (stock ETF or otherwise).
We all need to think for ourselves when it comes to trading our own accounts. First, it is
the only way to really learn. Second, we are the only ones responsible for our decisions.
Think of these charts as food for further analysis. Before making a trade, it is important
to have a plan. Plan the trade and trade the plan. Among other things, this includes setting
a trigger level, a target area and a stop-loss level. It is also important to plan for three
possible price movements: advance, decline or sideways. Have a plan for all three scenarios
BEFORE making the trade. Consider possible holding times. And finally, look at overall market
conditions and sector/industry performance.


