**This chart analysis is for educational purposes only, and should not
be construed as a recommendation to buy, sell or sell-short said securities**
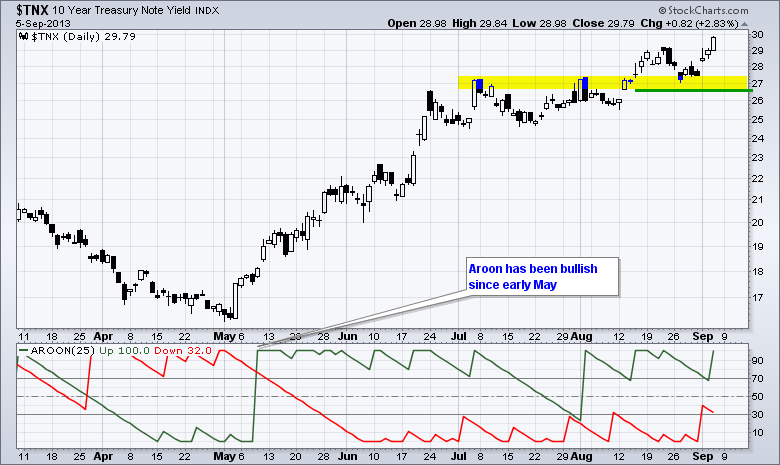
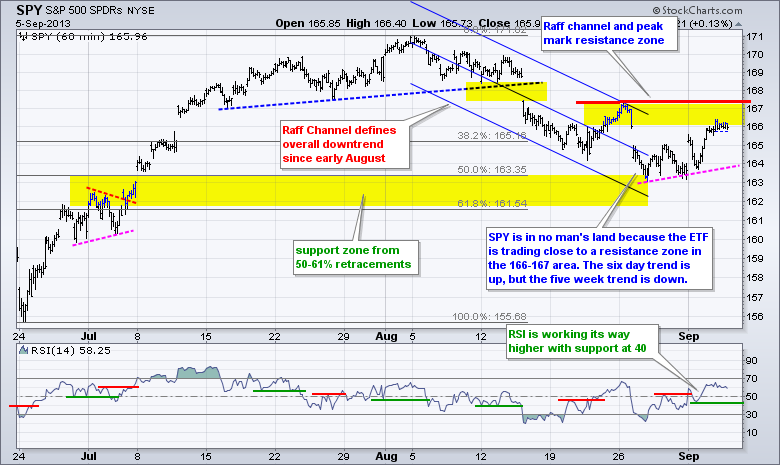
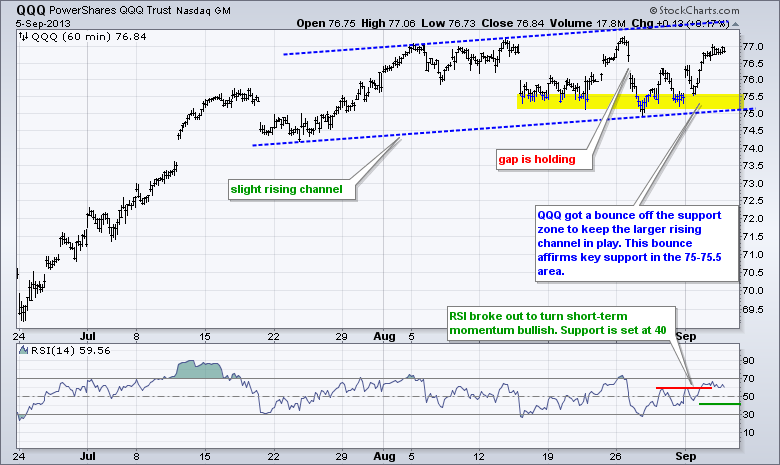
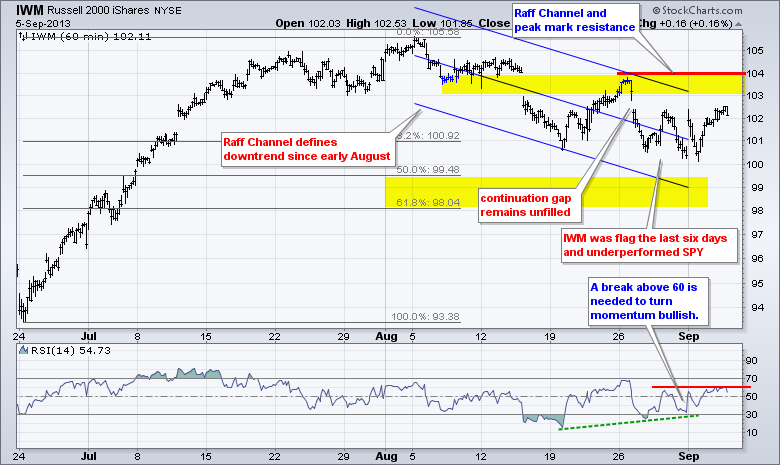
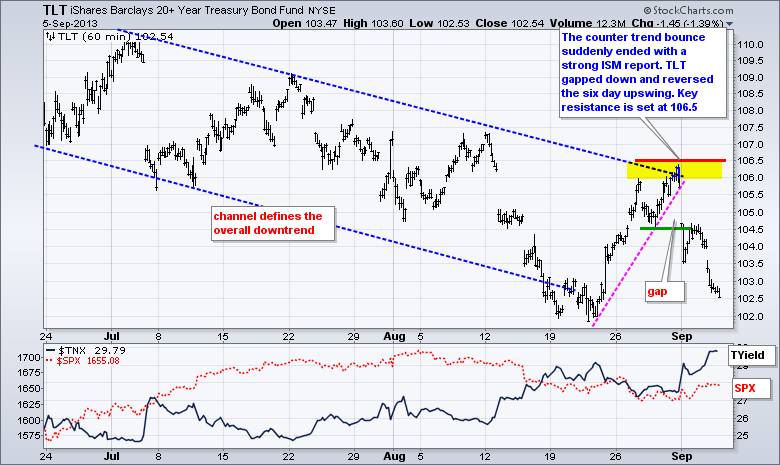
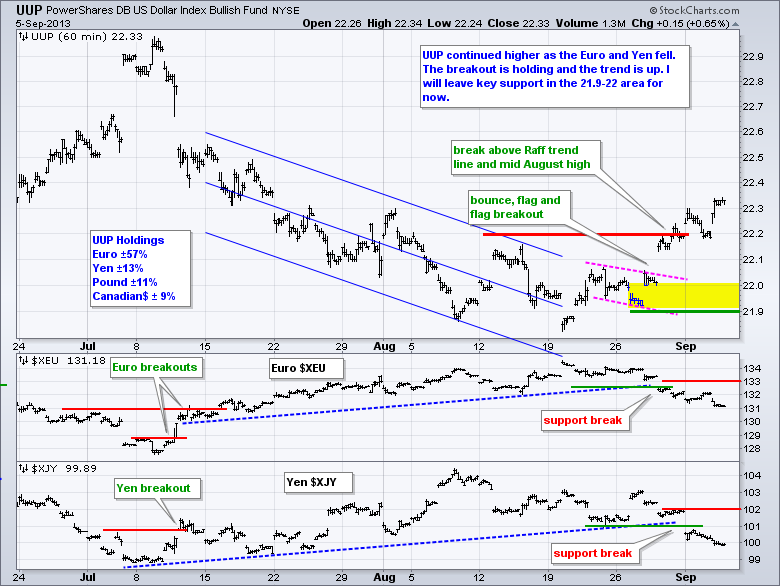
Stocks edged higher with techs leading the way again. The Nasdaq 100 Equal-Weight ETF (QQEW) advanced .49%, but the S&P 500 ETF (SPY) advanced just .13% on the day. Interest rate sensitive shares were hit again as strong economic numbers pushed Treasury yields higher. The 10-year Treasury Yield ($TNX) moved above 2.9% and will surely exceed 3% if Friday's jobs number is better-than-expected. On the economic front, the ISM Services Index reached 58.6, which was its highest reading in over 7 years. The new orders portion surged above 60. Jobless claims fell to 323,000 and extended the overall downtrend for this key employment indicator. In short, the economy shows signs of growth and the job market continues to improve. This favors tapering in the coming months. Tapering is actually positive because it means the economy can stand on its own and interest rates can move back to normal levels. Chartists looking to learn more about customizing charts and getting the most out of StockCharts should consider our upcoming seminar in New York (click here).

**************************************************************************
**************************************************************************
**************************************************************************
**************************************************************************
**************************************************************************
Key Reports and Events (all times Eastern):
Fri – Sep 06 – 08:30 – Employment Report
Sun – Sep 22 – 10:00 – German Elections
Tue – Oct 15 - 09:00 – Debt Ceiling Deadline
Charts of Interest: Tuesday and Thursday
This commentary and charts-of-interest are designed to stimulate thinking. This analysis is
not a recommendation to buy, sell, hold or sell short any security (stock ETF or otherwise).
We all need to think for ourselves when it comes to trading our own accounts. First, it is
the only way to really learn. Second, we are the only ones responsible for our decisions.
Think of these charts as food for further analysis. Before making a trade, it is important
to have a plan. Plan the trade and trade the plan. Among other things, this includes setting
a trigger level, a target area and a stop-loss level. It is also important to plan for three
possible price movements: advance, decline or sideways. Have a plan for all three scenarios
BEFORE making the trade. Consider possible holding times. And finally, look at overall market
conditions and sector/industry performance.

About the author:
Arthur Hill, CMT, is the Chief Technical Strategist at TrendInvestorPro.com. Focusing predominantly on US equities and ETFs, his systematic approach of identifying trend, finding signals within the trend, and setting key price levels has made him an esteemed market technician. Arthur has written articles for numerous financial publications including Barrons and Stocks & Commodities Magazine. In addition to his Chartered Market Technician (CMT) designation, he holds an MBA from the Cass Business School at City University in London.
Learn More


