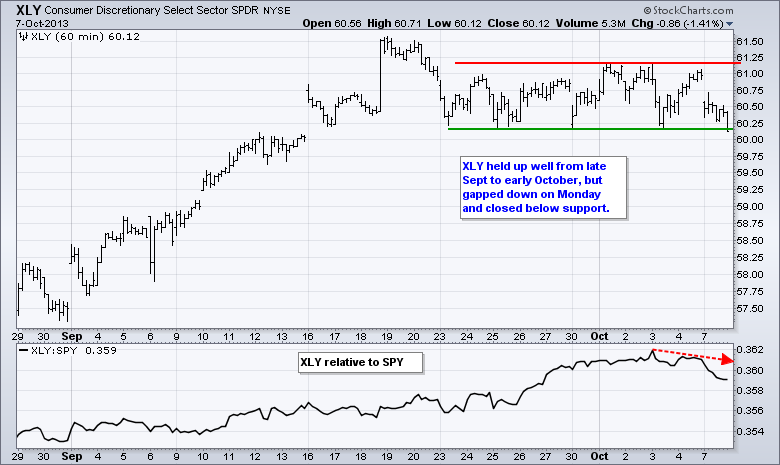
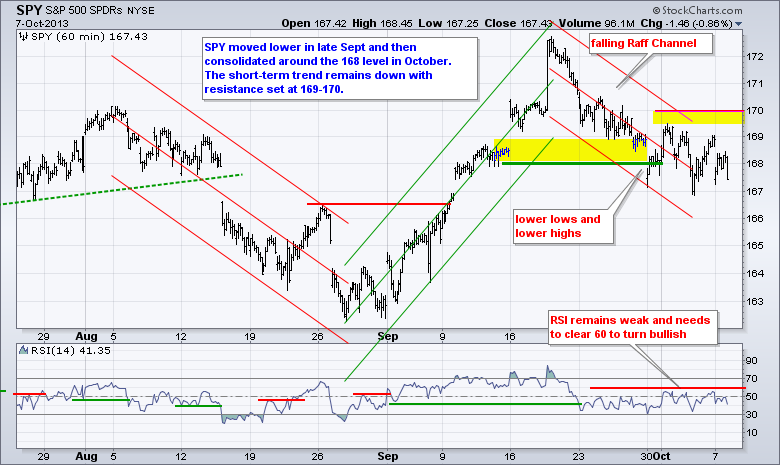
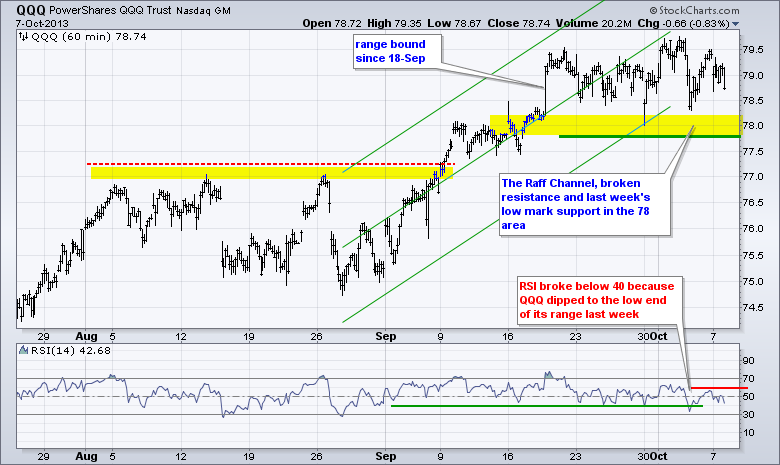
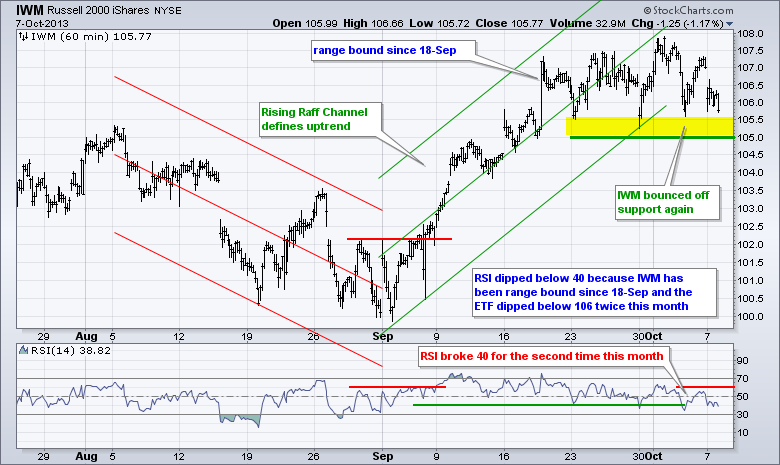
Stocks opened weak, bounced and then closed weak. Small-caps led the way lower with the Russell 2000 ETF (IWM) falling just over 1%. All sectors were down with the Consumer Discretionary SPDR (XLY), Finance SPDR (XLF), Basic Materials SPDR (XLB) and Healthcare SPDR (XLV) falling over 1%. Relative weakness in the consumer discretionary and finance sectors is a concern. The consumer discretionary represents the most economically sensitive sector. The finance sector is still the second largest sector in the S&P 500. I do not think the government shut down or debt ceiling deadline really affected the market today. Wall Street is probably betting on this going down to the wire with a resolution coming at 23:59 on October 17th. Yesterday's weakness in the stock market probably stems from recent downgrades and earnings warnings as third quarter earnings season nears. CNBC reports that 18 companies have issued positive earnings guidance, but a whopping 94 have issued negative guidance. I suspect that earnings affect stock prices more than government antics, unless of course this debacle extends past October 20th.

**************************************************************
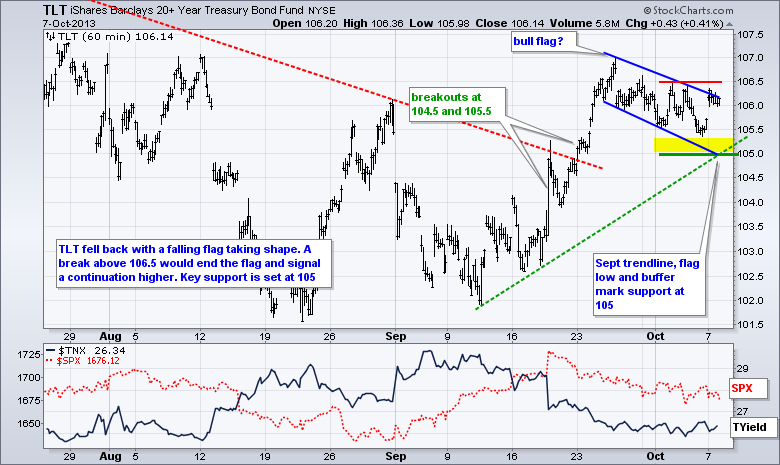
**************************************************************
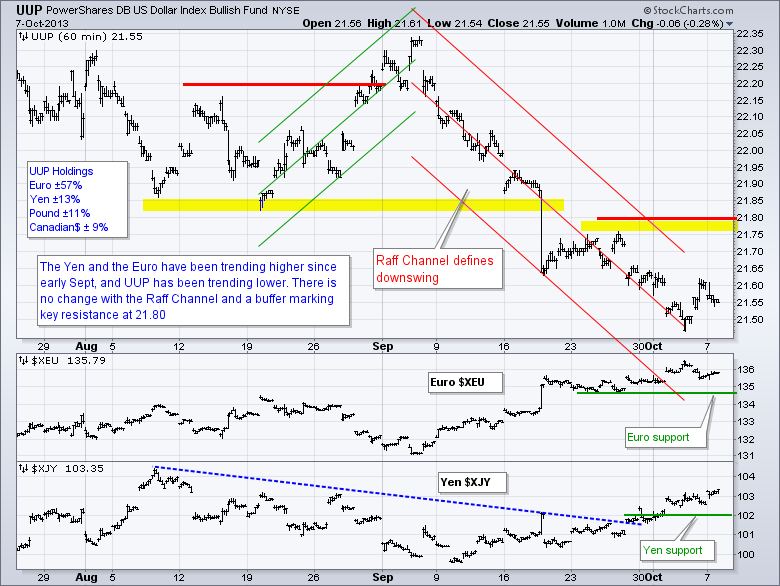
**************************************************************
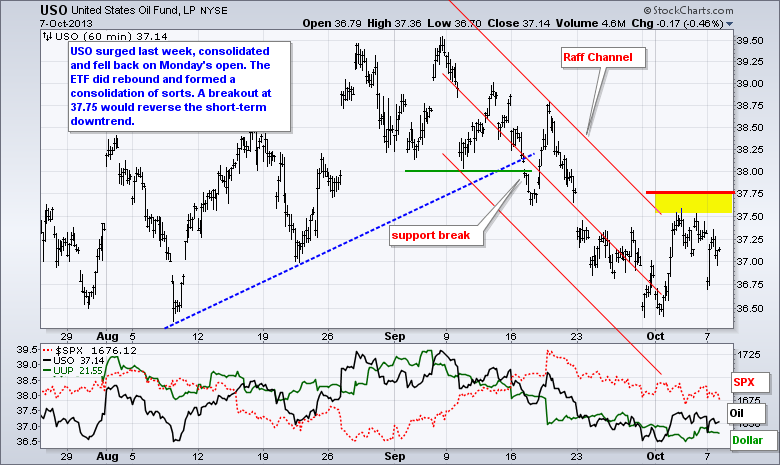
**************************************************************
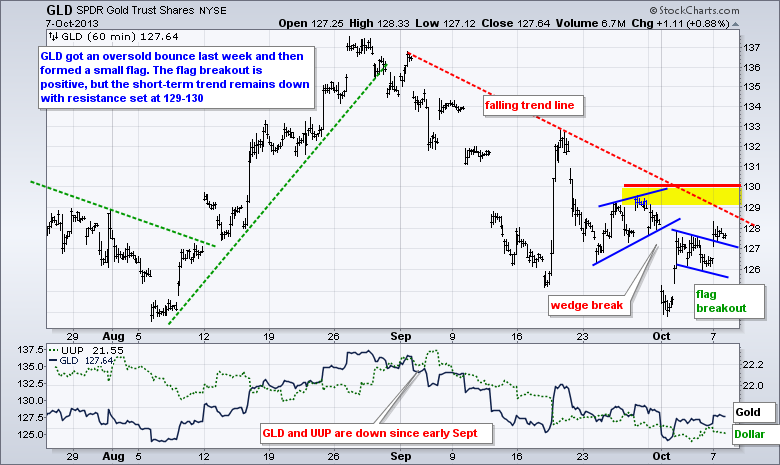
***************************************************************
Key Reports and Events (all times Eastern):
No government reports during the shutdown
Tue - Oct 08 - 08:30 – Alcoa (AA) kicks off earnings season
Wed - Oct 09 - 07:00 - MBA Mortgage Index
Wed - Oct 09 - 10:30 - Crude Oil Inventories
Wed - Oct 09 - 14:00 - FOMC Minutes
Thu - Oct 10 - 08:30 - Initial Jobless Claims
Thu - Oct 10 - 10:30 - Natural Gas Inventories
Fri - Oct 11 - 08:30 - Retail Sales
Fri - Oct 11 - 08:30 - Producer Price Index (PPI)
Fri - Oct 11 - 09:55 - Michigan Sentiment
Fri - Oct 11 - 10:00 - Business Inventories
Thu - Oct 17 - 23:59 - Debt Ceiling Deadline
Thu - Oct 24 - 09:00 - Government Runs out of Money (estimate)
Charts of Interest: Tuesday and Thursday
This commentary and charts-of-interest are designed to stimulate thinking. This analysis is
not a recommendation to buy, sell, hold or sell short any security (stock ETF or otherwise).
We all need to think for ourselves when it comes to trading our own accounts. First, it is
the only way to really learn. Second, we are the only ones responsible for our decisions.
Think of these charts as food for further analysis. Before making a trade, it is important
to have a plan. Plan the trade and trade the plan. Among other things, this includes setting
a trigger level, a target area and a stop-loss level. It is also important to plan for three
possible price movements: advance, decline or sideways. Have a plan for all three scenarios
BEFORE making the trade. Consider possible holding times. And finally, look at overall market
conditions and sector/industry performance.

About the author:
Arthur Hill, CMT, is the Chief Technical Strategist at TrendInvestorPro.com. Focusing predominantly on US equities and ETFs, his systematic approach of identifying trend, finding signals within the trend, and setting key price levels has made him an esteemed market technician. Arthur has written articles for numerous financial publications including Barrons and Stocks & Commodities Magazine. In addition to his Chartered Market Technician (CMT) designation, he holds an MBA from the Cass Business School at City University in London.
Learn More


