Art's Charts November 25, 2013 at 09:40 AM
Programming note: I am taking some holiday this week and Art's Charts will not be updated on Tuesday, Wednesday and Friday. The market is closed on Thursday and will close early on Friday (1PM)... Read More
Art's Charts November 21, 2013 at 06:40 AM
Programming note: I am on the road Friday and commentary for Art's charts will not be published on Friday. The next commentary will be on Monday. Taper talk allegedly weighed on the market Wednesday, but the declines in the major index ETFs were minimal... Read More
Art's Charts November 21, 2013 at 06:28 AM
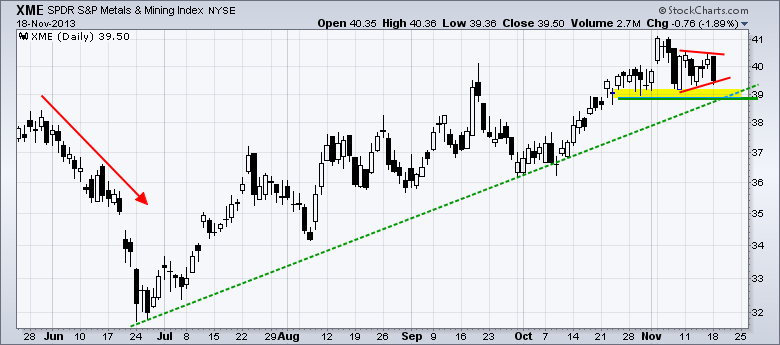
APC Forms Flag after High Volume Decline. ATML Springs a Bear Trap. Plus DHI, EMC and HPQ Individual charts are below video... Read More
Art's Charts November 20, 2013 at 04:34 AM
Stocks corrected the last two days with relatively mild selling pressure. The Russell 2000 ETF (IWM) lost .62% and the S&P 500 ETF (SPY) fell just .22%. IWM continues to show relative weakness over the last six weeks. The sectors were mixed with six down and three up... Read More
Art's Charts November 19, 2013 at 07:03 AM
Stocks traded relatively flat the first part of the day and then got hit with selling pressure in the afternoon. Techs led the way down with the Nasdaq 100 ETF (QQQ) losing around 1%... Read More
Art's Charts November 19, 2013 at 06:56 AM
CAT Extends Post-Gap Consolidation. COF Shows Relative Weakness as Wedge Forms. Plus DOW, FB, MOVE, NVR, PEG, RDC Individual charts are below the video. Sorry but your browser doesn't support HTML5 video... Read More
Art's Charts November 18, 2013 at 06:14 AM
The bulls continue to press their case as the major index ETFs scored modest gains for the week. It is not as if buying pressure is especially strong. Buying pressure, however, is clearly stronger than selling pressure. In fact, selling pressure is pretty much non-existent... Read More
Art's Charts November 15, 2013 at 05:51 AM
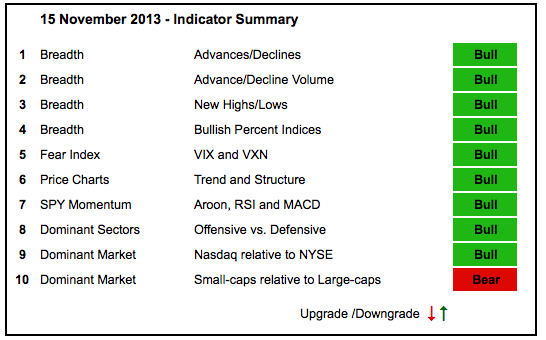
There is no change in the indicator summary as the bulk of the evidence remains bullish. We saw new highs in SPY, RSP and MDY this week. The NYSE AD Volume Line also hit a new high. Net New Highs surged as buying pressure picked up in November... Read More
Art's Charts November 15, 2013 at 04:51 AM
Stocks got a bounce, but there were some pockets of weakness in the market. Get this. The Russell 1000 iShares (IWB) moved higher, but the Russell 2000 ETF (IWM) edged lower. We can blame this on the growth component because the Russell 2000 Value iShares (IWN) was up ... Read More
Art's Charts November 14, 2013 at 07:52 AM
Video for Art's Charts: BAX Bounces off Support with Good Volume. BIIB Hits an Interesting Juncture. Plus CNL, MAS, SIAL, TE, WFC Sorry but your browser doesn't support HTML5 video... Read More
Art's Charts November 14, 2013 at 06:54 AM
Trading started mixed on Wednesday, but stocks caught a midday bid and raced higher to close strong. The Nasdaq 100 ETF (QQQ) and the Russell 2000 ETF (IWM) led the way. All sectors were up with the Consumer Discretionary SPDR (XLY) leading (+1.58%)... Read More
Art's Charts November 14, 2013 at 05:52 AM

BAX Bounces off Support with Good Volume. BIIB Hits an Interesting Juncture. Plus CNL, MAS, SIAL, TE, WFC Individual charts are below. Sorry but your browser doesn't support HTML5 video... Read More
Art's Charts November 13, 2013 at 03:37 AM
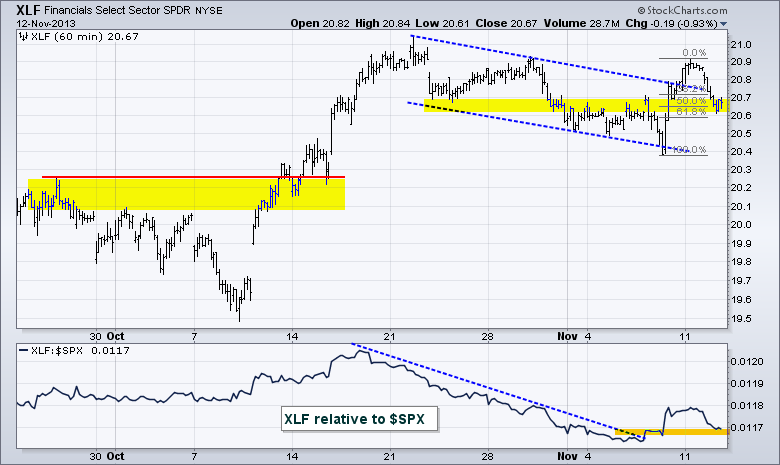
It was another mixed day for the major index ETFs. The Nasdaq 100 ETF (QQQ) edged higher, while the S&P 500 ETF (SPY) edged lower. Six of the nine sector SPDRs finished lower with the Finance SPDR (XLF), Energy SPDR (XLE) and Utilities SPDR (XLU) leading the way... Read More
Art's Charts November 12, 2013 at 06:18 AM
Stocks meandered in slow trading on Monday. The Nasdaq 100 ETF (QQQ) edged lower and the S&P 500 ETF (SPY) edged higher. The sectors were mixed with fractional gains and losses... Read More
Art's Charts November 12, 2013 at 06:14 AM
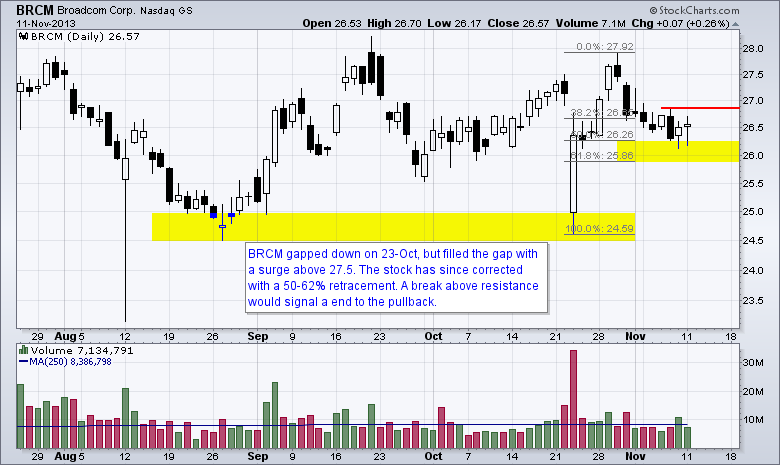
BRCM Firms at 50-62% Retracement. DF Forms Bull Flag after Surge. Plus DHI, FNSR, TSO Video is at top. Individual charts are below... Read More
Art's Charts November 11, 2013 at 05:56 AM
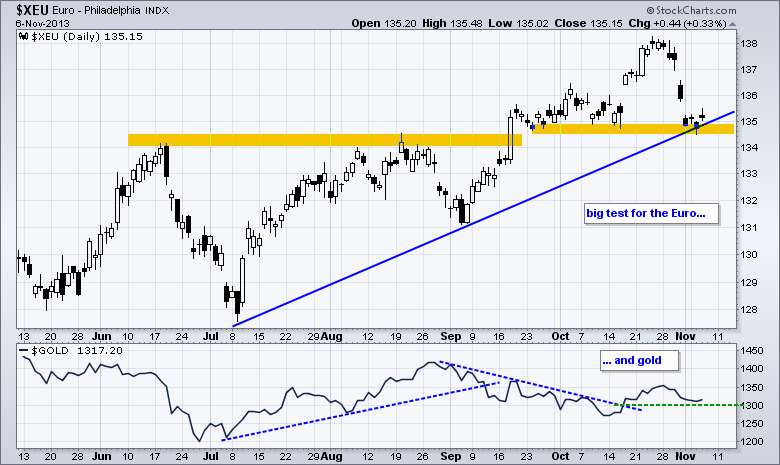
The bulls went on a run after non-farm payrolls beat expectations and prior months were revised higher. Strength in employment put tapering back on the agenda and weighed on bonds. Taper-talk also weighed on gold as the Dollar surged and held last week's breakout... Read More
Art's Charts November 08, 2013 at 07:29 AM
This article can be found in the Mailbag blog (click here)... Read More
Art's Charts November 08, 2013 at 05:50 AM
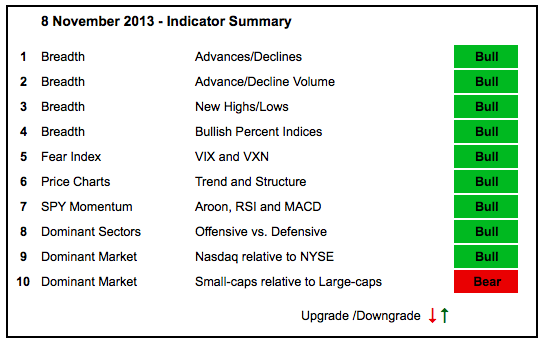
The bulk of the evidence remains bullish, but this uptrend is getting long in tooth and the market is ripe for a correction. Note that the majority of technical indicators have been positive for a year now, which is the longest stretch since I began this table... Read More
Art's Charts November 08, 2013 at 04:32 AM
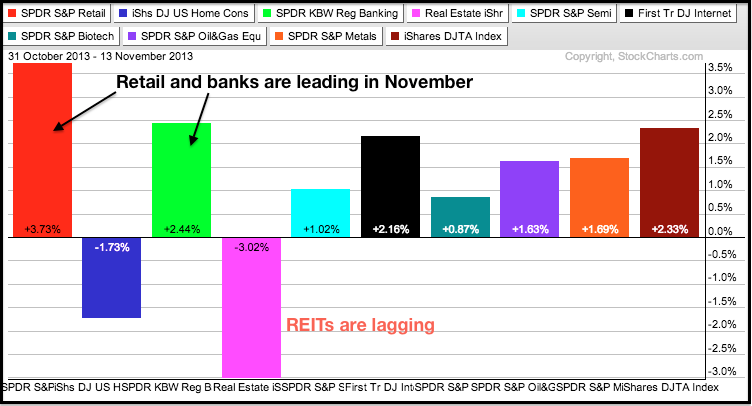
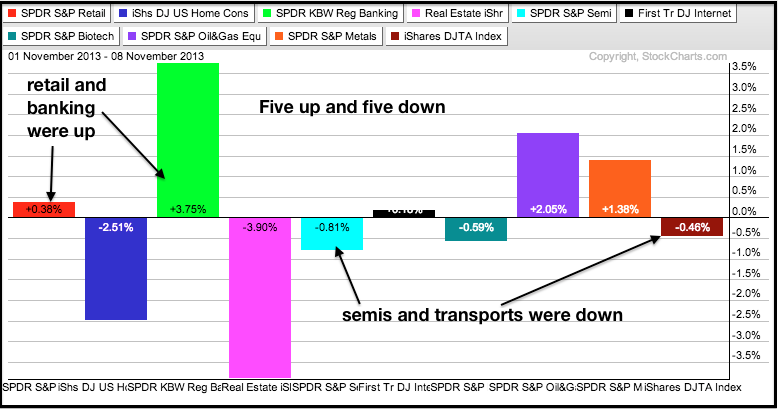
Things that make you go hmm.... Stocks declined and a few media reports blamed a better-than-expected GDP report. Also note that October same-store retail sales were up 4%, which ain't bad considering all that shutdown stuff... Read More
Art's Charts November 07, 2013 at 05:50 AM
It was a strange day on Wall Street. The Dow Industrials surged over 100 points, but the Russell 2000 fell .43%. The Consumer Staples SPDR (XLP) and Utilities SPDR (XLU) led the market higher, but the Technology SPDR (XLK) also showed relative strength with a 1.01% gain... Read More
Art's Charts November 07, 2013 at 05:31 AM
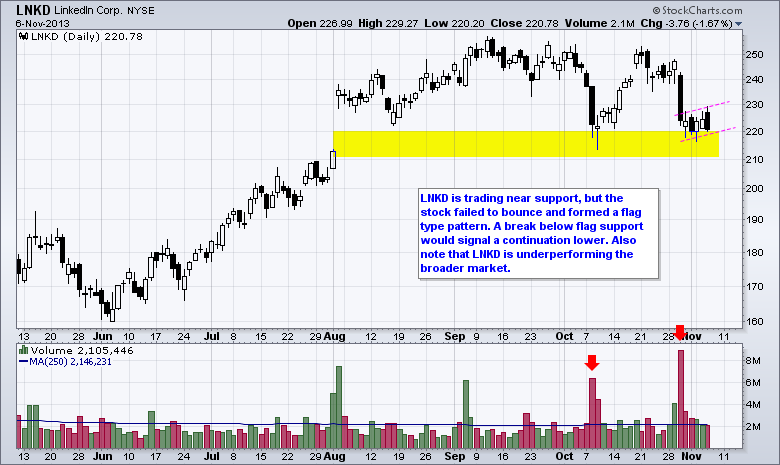
LNKD Forms Bear Flag at Support. MDR Surges with Huge Volume. Plus MOVE, STX, WIN, YELP Video is at top. Individual charts are below... Read More
Art's Charts November 06, 2013 at 04:51 AM
Stocks edged lower on Tuesday with the major index ETFs ending with small losses. The S&P Midcap SPDR (MDY) fell .63% and the S&P 500 ETF (SPY) lost .32%, but the Nasdaq 100 ETF (QQQ) bucked the selling with a fractional gain (+.11%)... Read More
Art's Charts November 05, 2013 at 07:39 AM
Stocks rebounded on Monday with modest gains in the major index ETFs. Small-caps led the recovery as the Russell 2000 ETF (IWM) gained 1.15% on the day... Read More
Art's Charts November 05, 2013 at 07:34 AM
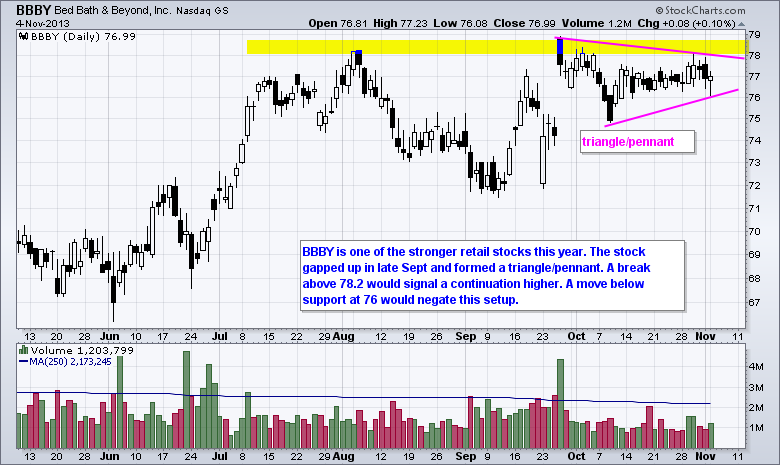
BBBY Consolidates After Big Gap. BOOM Turns Volatile on High Volume. Plus EBAY, GTIV, IGT, IMMR, PMTC, RLGY Video is at top. Individual charts are below... Read More
Art's Charts November 04, 2013 at 06:16 AM
Stocks finally took a breather last week as small-caps led the correction. The Nasdaq 100 ETF (QQQ) and S&P 500 ETF (SPY) corrected with trading ranges, while the Russell 2000 ETF (IWM) corrected with a 2.13% decline... Read More
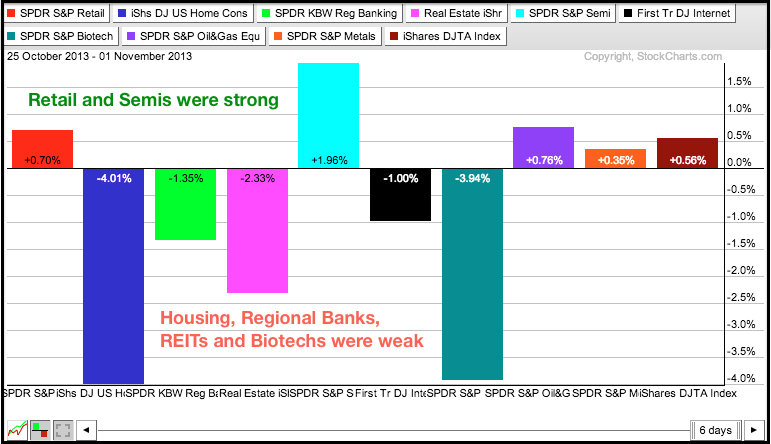
Art's Charts November 01, 2013 at 06:09 AM
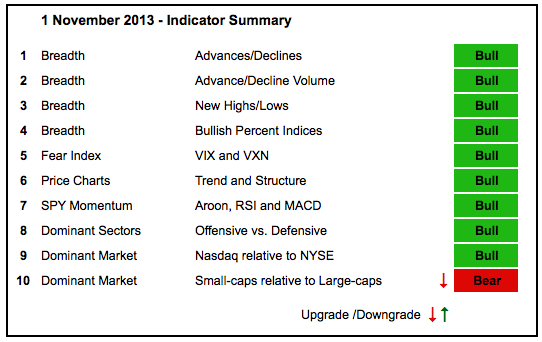
The indicator summary remains firmly positive, but stocks stumbled this week with small-caps and financials weighing on the market. After big runs the last three weeks, the major index ETFs are again short-term overbought... Read More
Art's Charts November 01, 2013 at 04:36 AM
Stocks were mostly weak on Thursday, but selling pressure was modest and there were a few pockets of strength. The Russell 2000 ETF (IWM) led the way lower with a .58% decline. The Nasdaq 100 Equal-Weight ETF (QQEW) managed a .03% gain on the day... Read More