Art's Charts October 31, 2013 at 10:39 AM
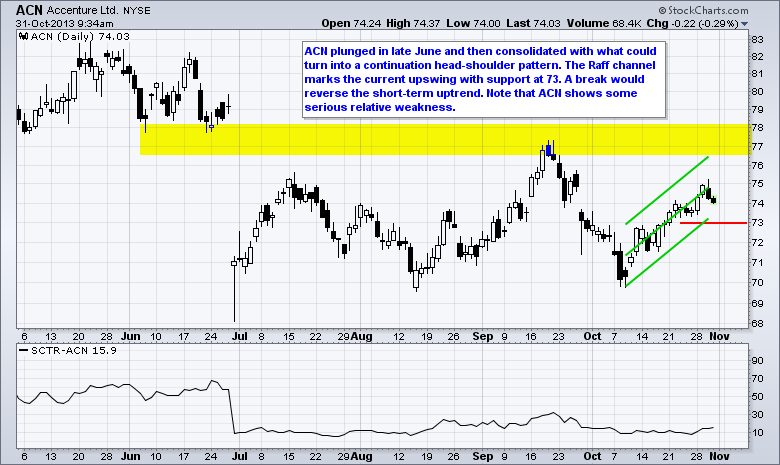
Big banks show relative weakness and short-term breakdowns. BAC C JPM. Plus $HOG and $ACN Video is at top. Individual charts are below... Read More
Art's Charts October 31, 2013 at 08:51 AM
Stocks finally took a breather with small-caps leading the way lower. The Russell 2000 ETF (IWM) fell 1.37% and the Russell Microcap ETF (IWC) fell 1.70%. All sectors were down, but the losses were relatively modest. The Consumer Staples SPDR (XLP) led the way lower with a ... Read More
Art's Charts October 30, 2013 at 06:23 AM
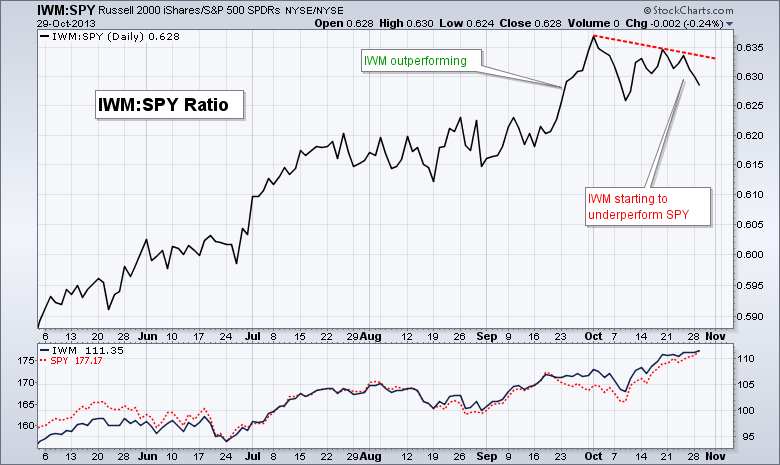
The rally rabbit continued its run as the S&P 500 ETF (SPY) hit a new high. All major index ETFs were up, but the gains were modest and I am starting to see a little relative weakness in the Russell 2000 ETF (IWM) and S&P Midcap SPDR (MDY)... Read More
Art's Charts October 29, 2013 at 06:34 AM
Stocks finished mixed on Monday with the Russell 2000 ETF (IWM) falling .05% and the S&P 500 ETF (SPY) rising .16%. The sectors were also mixed with relatively small moves, excluding the Consumer Staples SPDR (XLP), which surged 1.31% and hit a new high... Read More
Art's Charts October 29, 2013 at 06:29 AM
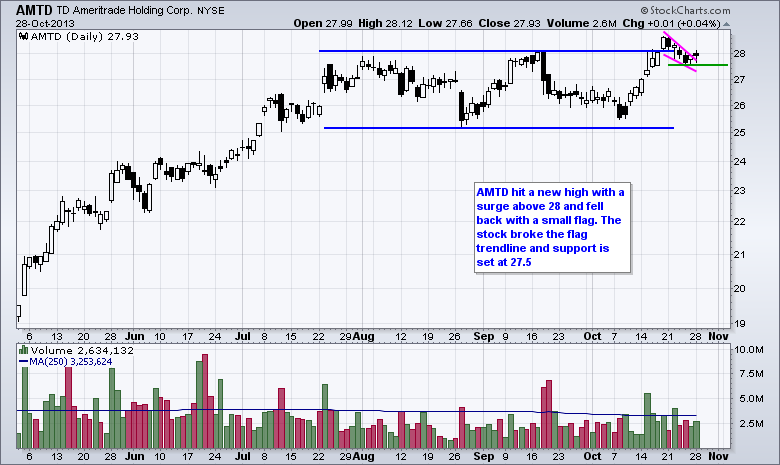
AMTD Forms Flag after Breakout. Aroon Indicators in Parallel Decline for $ATVI. Plus $CPRT $CX $EA $RDC $TTWO $TSN Video is at top. Individual charts are below... Read More
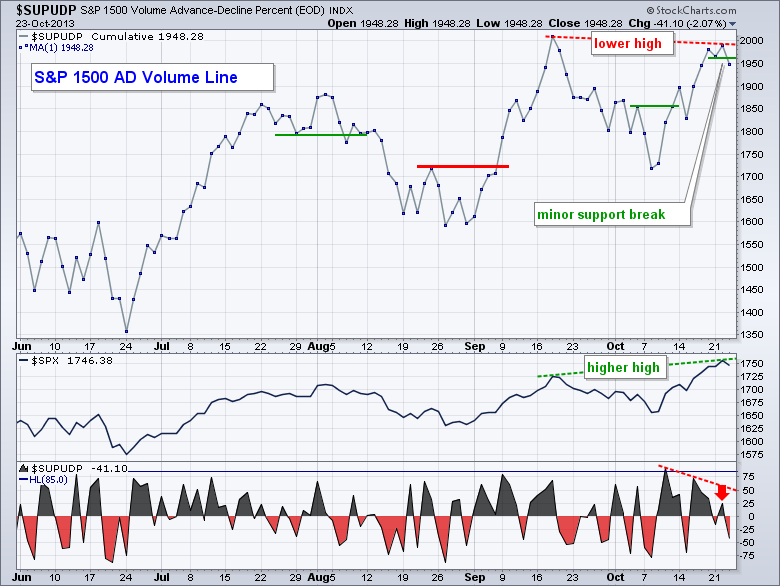
Art's Charts October 25, 2013 at 05:07 AM
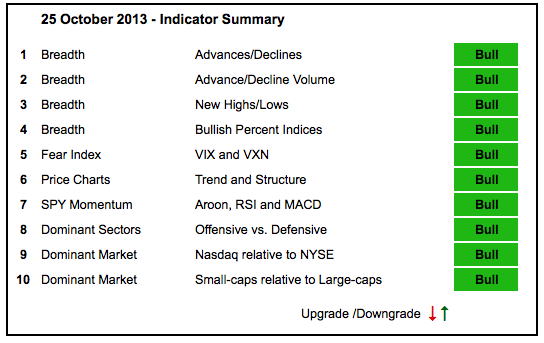
Stocks simply continue to march higher. Buying pressure may be waning, but it is still outpacing selling pressure. The Nasdaq and NYSE AD Lines and AD Volume Lines hit new highs... Read More
Art's Charts October 25, 2013 at 04:14 AM
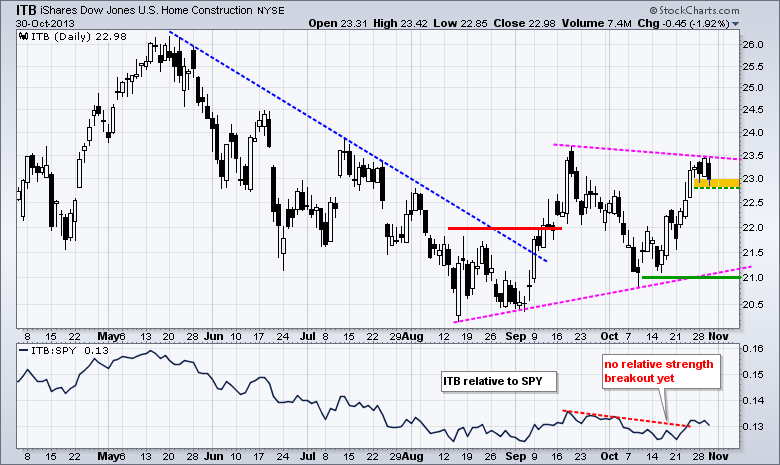
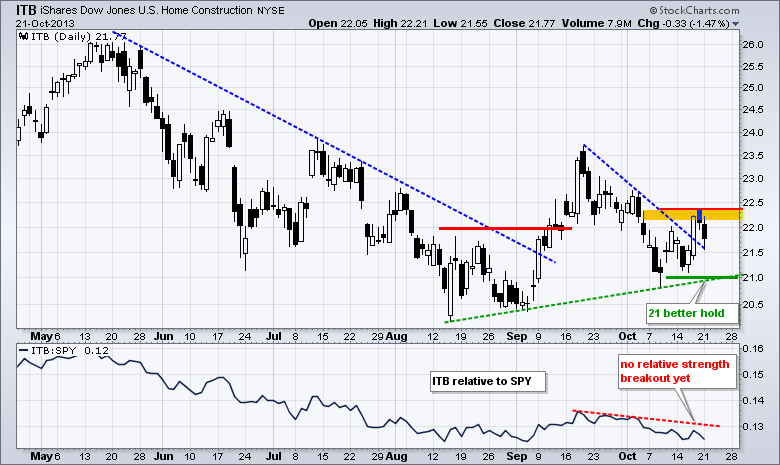
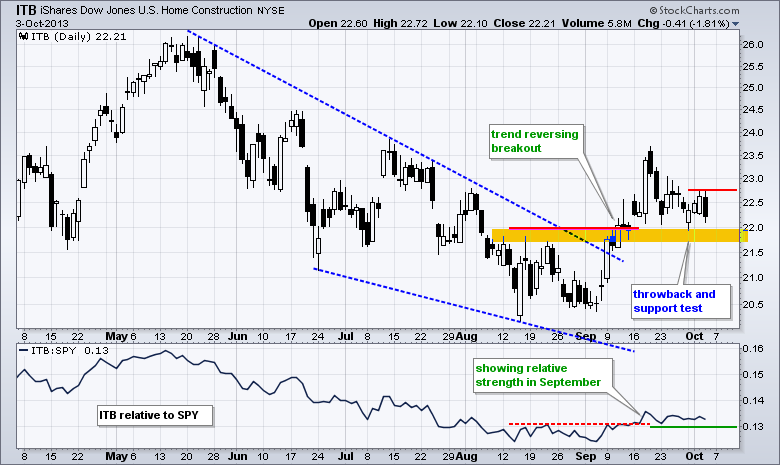
The major index ETFs edged higher with modest gains. Selling pressure hit some areas of the market, but there were some pockets of serious strength that lifted the stocks. In particular, the Home Construction iShares (ITB) continued its rise with a 2.84% advance on the day... Read More
Art's Charts October 24, 2013 at 07:25 AM
After hitting new highs for the move early Tuesday, stocks weakened over the last two days with the Technology SPDR (XLK) and Energy SPDR (XLE) leading the way lower. Over the last three days, the S&P 500 ETF (SPY) formed a reversal with a gap up, consolidation and gap down... Read More
Art's Charts October 24, 2013 at 07:20 AM
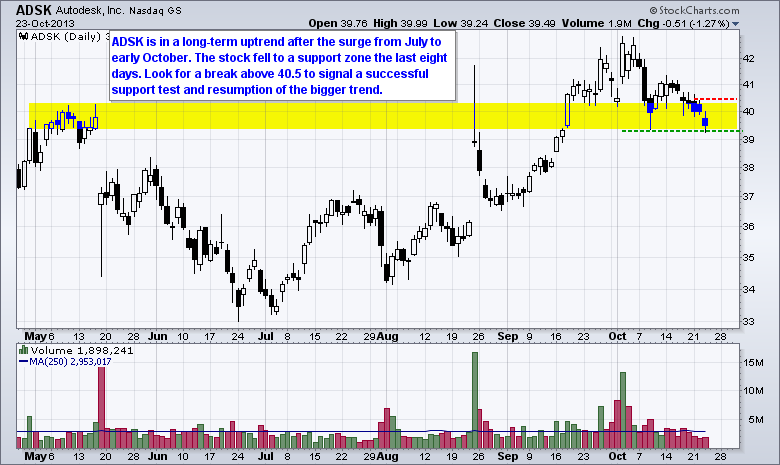
ADSK Hits Support Zone after Pullback. CZR Retraces 62% with a Wedge. Plus SRPT, USG, WDAY Video is at top. Individual charts are below... Read More
Art's Charts October 23, 2013 at 04:37 AM
Stocks extended their rally with another broad based advance. The S&P 500 ETF (SPY) and the S&P Equal Weight ETF (RSP) both gained around .70% on the day... Read More
Art's Charts October 22, 2013 at 06:35 AM
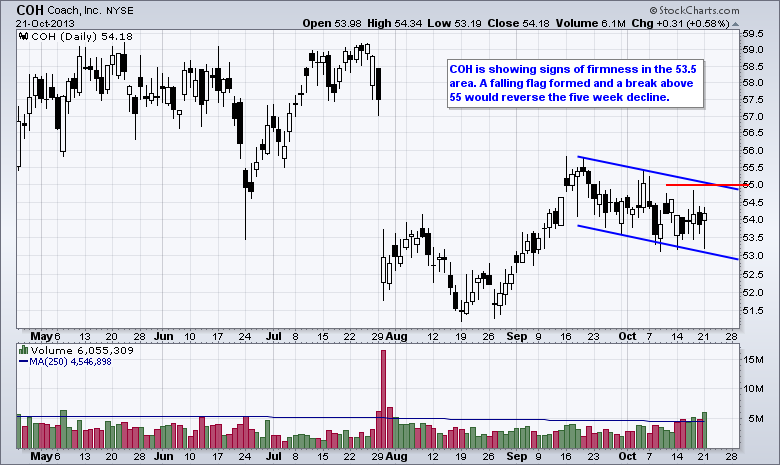
COH Firms within Falling Flag. DOX Breaks out on Good Volume. Plus GTIV, LMT and RTN Video is at top. Individual charts are below... Read More
Art's Charts October 22, 2013 at 06:31 AM
Stocks treaded water with mixed trading on Monday. The Nasdaq 100 ETF (QQQ) edged higher with a .22% gain, while the Russell 2000 ETF (IWM) edged lower with a .20% loss. The sectors were mixed with the Technology SPDR (XLK) gaining .54% and the Healthcare SPDR (XLV) loosing .51%... Read More
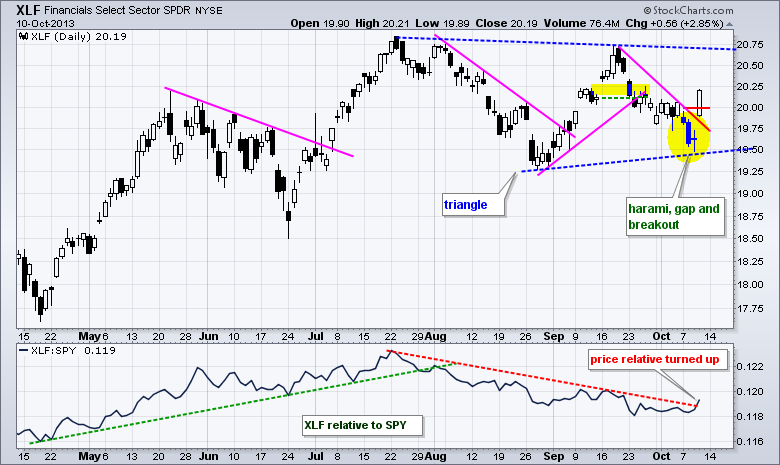
Art's Charts October 21, 2013 at 04:03 AM
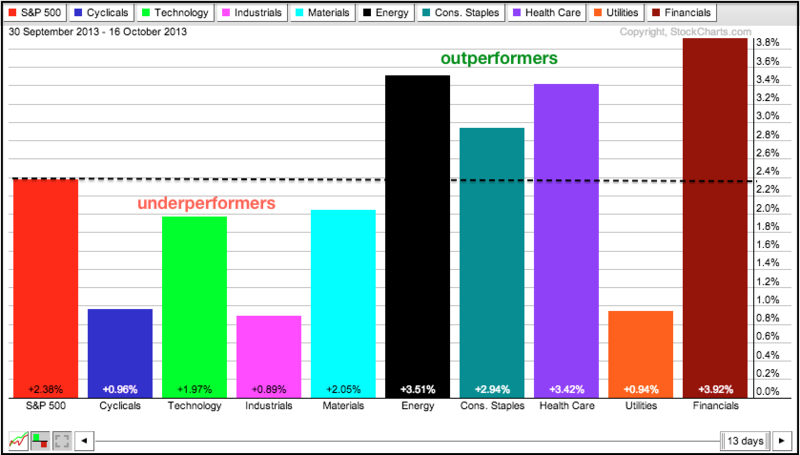
The bull stampede continued last week as the Nasdaq 100 ETF (QQQ) led the major index ETFs to new highs. All sectors were higher last week with the Finance SPDR (XLF) and Energy SPDR (XLE) leading the charge... Read More
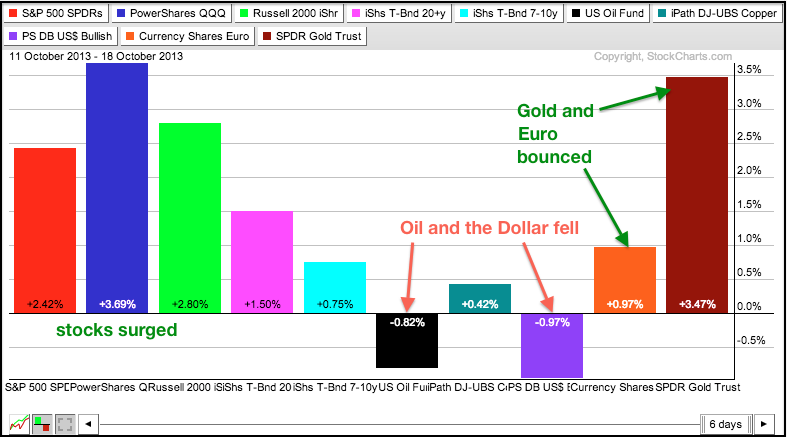
Art's Charts October 18, 2013 at 05:08 AM
There are some minor divergences brewing, but the overall picture remains positive for stocks. The market is clearly strong as four of the five major index ETFs surged to new highs this week. The Dow SPDR (DIA) is the lone laggard because it remains below its September high... Read More
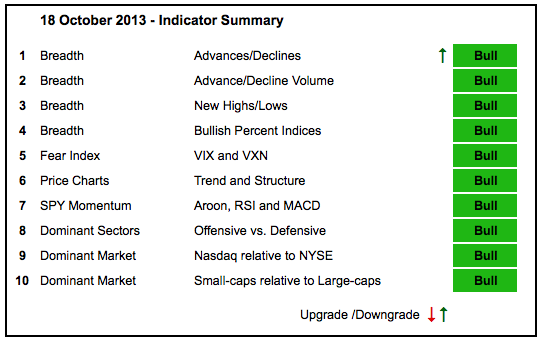
Art's Charts October 18, 2013 at 04:01 AM
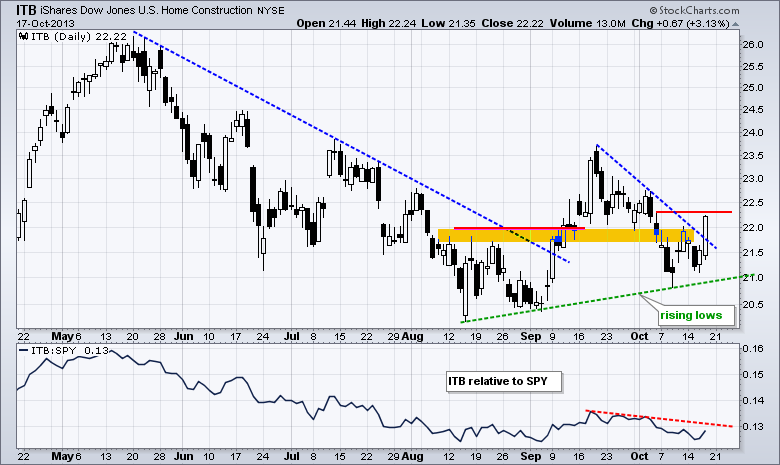
Stocks continued their march higher with interest rate sensitive issues leading the charge. The Utilities SPDR (XLU) led the sectors higher with a 1.62% gain and the Home Construction iShares (ITB) surged above the mid September trend line... Read More
Art's Charts October 17, 2013 at 06:00 AM
The government reopened as congress passed a deal and the president signed off. That is the good news. The bad news is that this process will repeat itself early next year. This would be funny, if it weren't so sad... Read More
Art's Charts October 17, 2013 at 05:56 AM
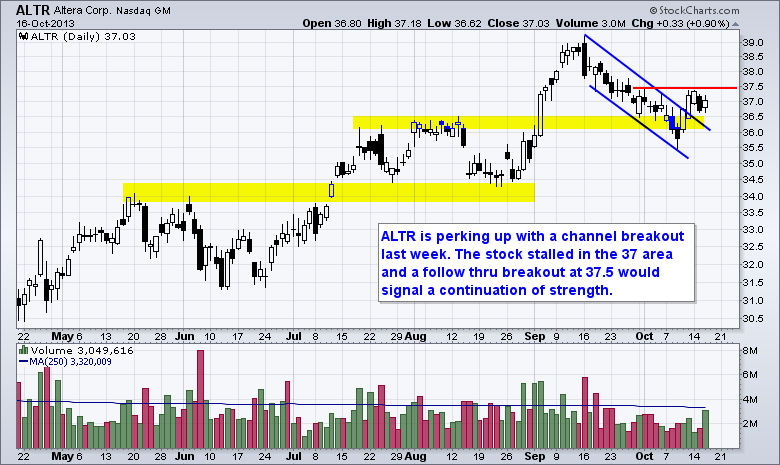
ALTR Breaks Channel Resistance. CHRW Hits Resistance at Gap. Plus JNPR, LEN and WY Video is at top. Individual charts are below... Read More
Art's Charts October 15, 2013 at 07:42 AM
The on-off deal in Washington DC was off on the open and back on by the close. Accordingly, stocks opened weak and closed strong with the Russell 2000 ETF (IWM) and Nasdaq 100 ETF (QQQ) hitting new highs... Read More
Art's Charts October 15, 2013 at 07:36 AM
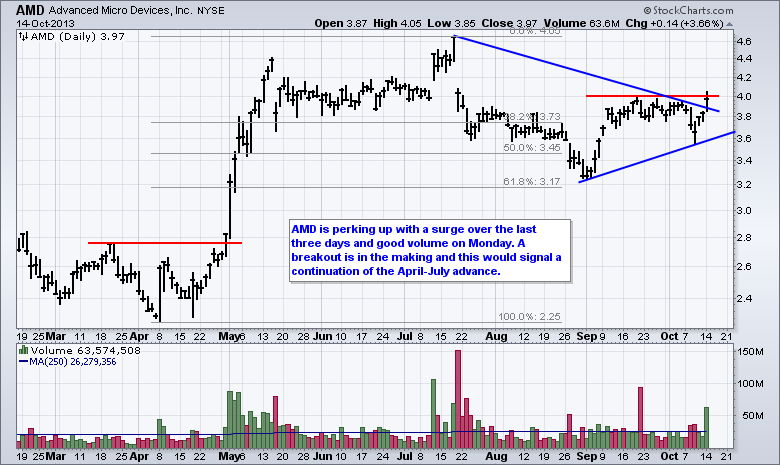
AMD Challenges Key Level with Volume. PENN Forms Continuation Pattern after Breakout. Plus PFE, RDC, RF, STI Video is at top. Individual charts are below... Read More
Art's Charts October 14, 2013 at 05:46 AM
Signs of hope dissipated over the weekend as the war of words took over in Washington. It is hard to say what is a negotiating ploy and what it substantive. One this seems for sure though: this is going to go down to the wire and any deal will likely come at the last minute... Read More
Art's Charts October 14, 2013 at 05:24 AM
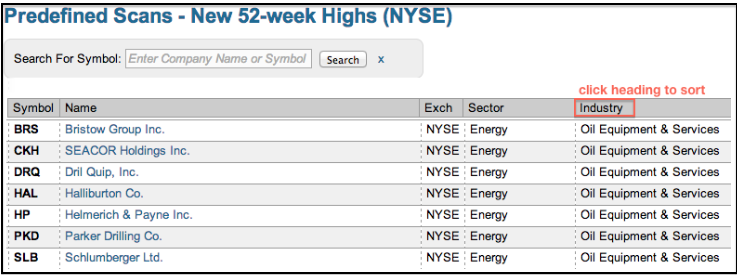
The Oil Equipment & Services industry was hot on Monday with several stocks hitting new highs. Chartists can find a list of new highs on the pre-defined scans page, which is updated throughout the trading day... Read More
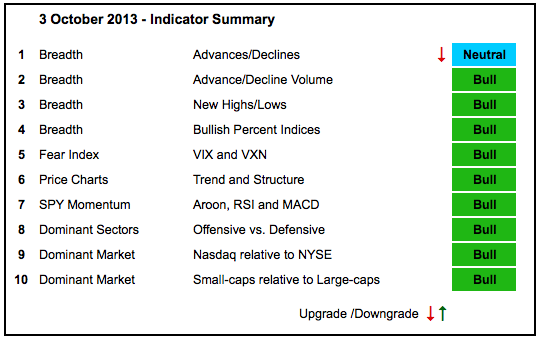
Art's Charts October 11, 2013 at 04:41 AM
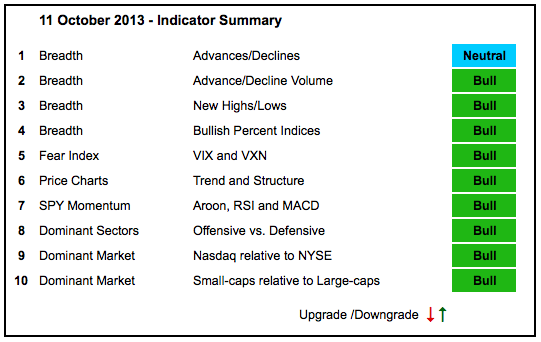
Stocks pulled back in early October, but the long-term uptrends were never in jeopardy and the indicator summary stayed green the entire time. Net New Highs for the Nasdaq and NYSE dipped to the zero line earlier this week, but bounced with Thursday's stock market surge... Read More
Art's Charts October 11, 2013 at 03:37 AM
Stocks surged on hopes of a deal in Washington... Read More
Art's Charts October 10, 2013 at 05:15 AM
Stocks started the day weak, but caught a lunchtime bid and bounced off their morning lows. There was no follow through to this bounce as the major index ETFs fell back in the final hour and ended the day mixed... Read More
Art's Charts October 10, 2013 at 05:07 AM
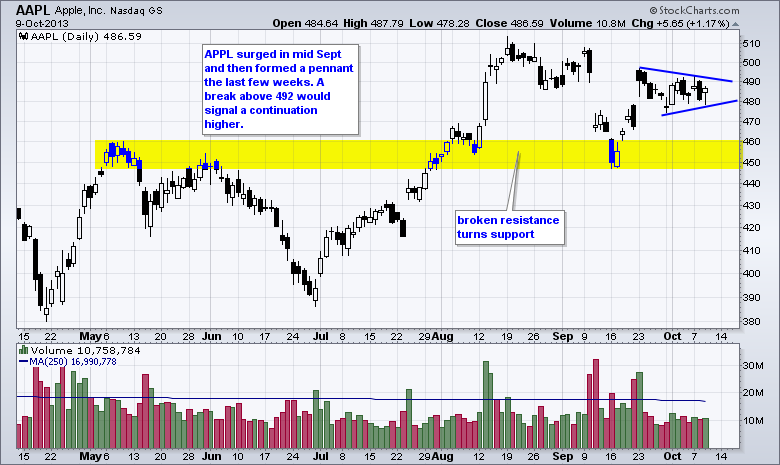
AAPL Forms Bullish Continuation Pattern. APH Firms at Support with Good Volume. Plus CL, CVS, FLO, TEVA Video is at top. Individual charts are below... Read More
Art's Charts October 09, 2013 at 04:26 AM
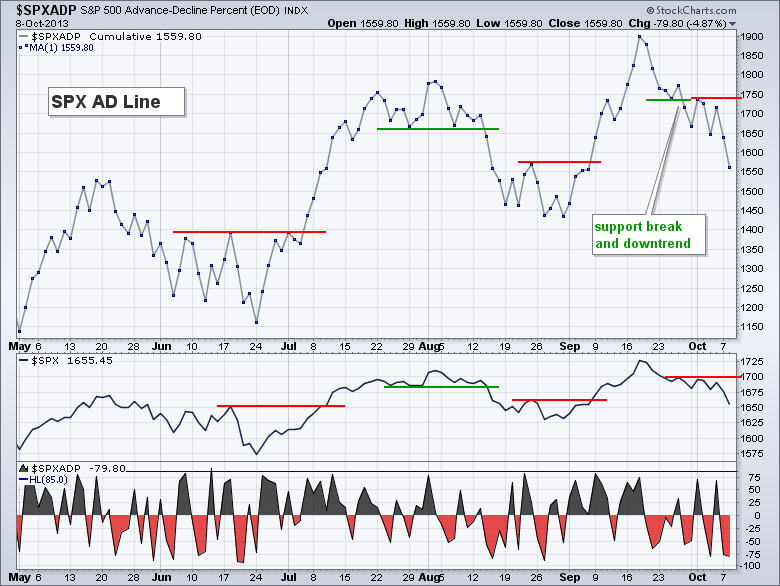
Stocks took it on the chin with broad-based selling pressure on Tuesday. The Nasdaq 100 ETF (QQQ) and Russell 2000 ETF (IWM) led the way and broke short-term support levels. This means IWM and QQQ have joined SPY and DIA with downtrends... Read More
Art's Charts October 08, 2013 at 07:54 AM
Stocks opened weak, bounced and then closed weak. Small-caps led the way lower with the Russell 2000 ETF (IWM) falling just over 1%... Read More
Art's Charts October 08, 2013 at 07:48 AM
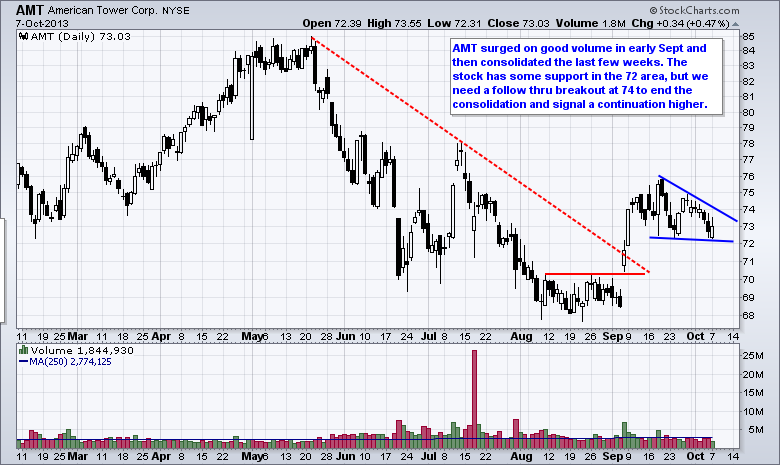
AMT Consolidates after Gap-Breakout. ATML Fall on Expanding Volume... Read More
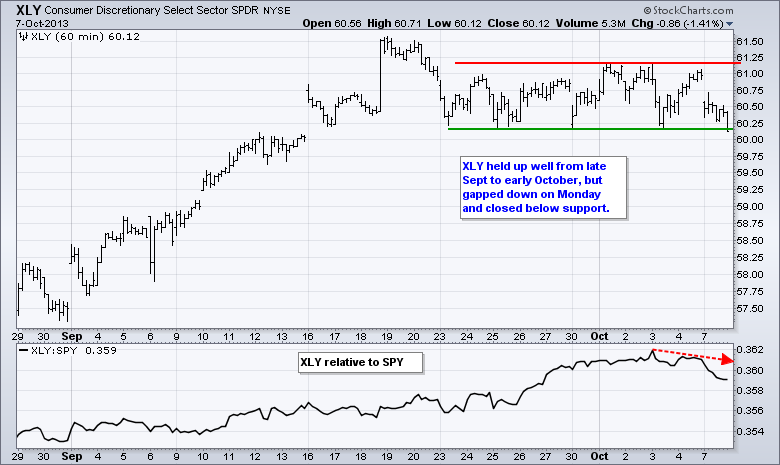
Art's Charts October 07, 2013 at 04:31 AM
It remains a tale of two markets. The Dow Industrials SPDR and the S&P 500 ETF are weak and in short-term downtrends. The Russell 2000 ETF and Nasdaq 100 ETF are holding up and remain in consolidation patterns since September 18th... Read More
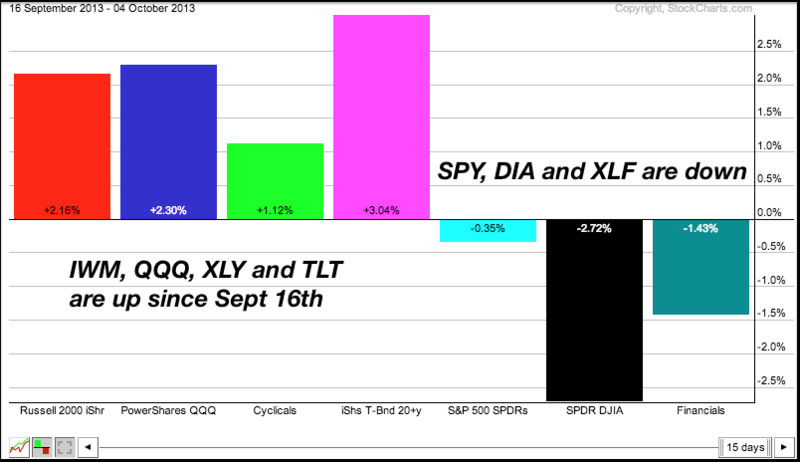
Art's Charts October 04, 2013 at 04:16 AM
The Dow Industrials SPDR and the S&P 500 ETF pulled back over the last two weeks, but the Nasdaq 100 ETF and Russell 2000 ETF held strong and hit new highs earlier this week. Relative strength in QQQ and IWM is more important than relative weakness in SPY and DIA... Read More
Art's Charts October 04, 2013 at 03:20 AM
Stocks moved lower with broad-based selling pressure on Thursday. Stocks just don't seem to know what they want... Read More
Art's Charts October 03, 2013 at 07:07 AM
Stocks edged lower on Wednesday, but the losses were fairly muted. The Russell 2000 ETF (IWM) fell .41% and the S&P 500 ETF (SPY) declined just .09% on the day. The sectors were mixed with small gains and losses... Read More
Art's Charts October 03, 2013 at 06:59 AM
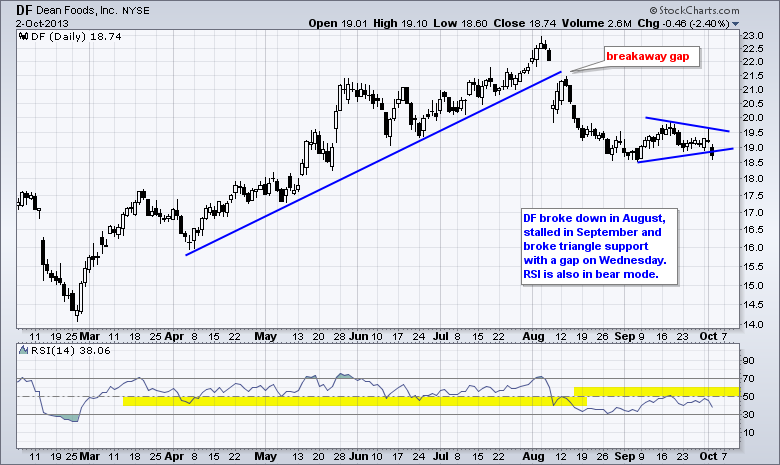
DF Breaks Triangle Support to Continue Downtrend. FFIV Bounces off Breakout Zone. Plus INFY, PFE, XRAY Video is at top. Individual charts are below... Read More
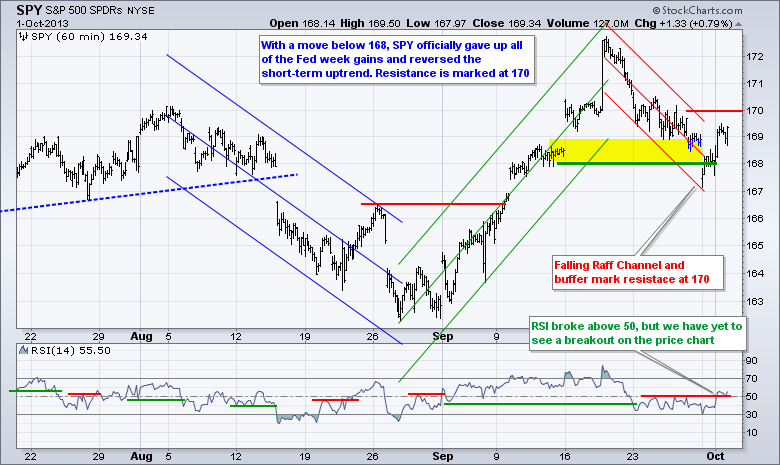
Art's Charts October 02, 2013 at 04:09 AM
Theshut down was not enough to derail the first trading day of the month phenomenon. There has been a bullish bias on the first trading day of the month for years now. Managers accumulate funds during the month and then deploy them at the beginning of the next month... Read More
Art's Charts October 01, 2013 at 06:28 AM
**This chart analysis is for educational purposes only, and should not be construed as a recommendation to buy, sell or sell-short said securities** There is a lot of uncertainty in the market place right now and this means every little news bite could trigger a price swing... Read More
Art's Charts October 01, 2013 at 06:22 AM
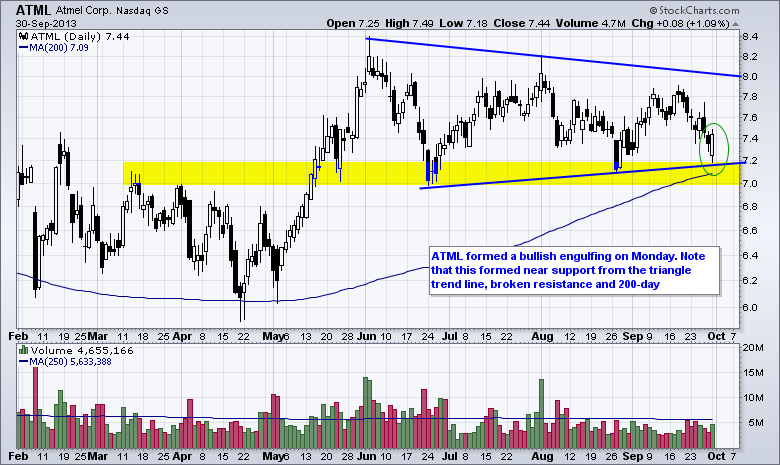
ATML Tests Support with Bullish Candlestick. Broken Resistance Turns Support for CREE. Plus FLIR, LULU, VMC Video is at top. Individual charts are below... Read More