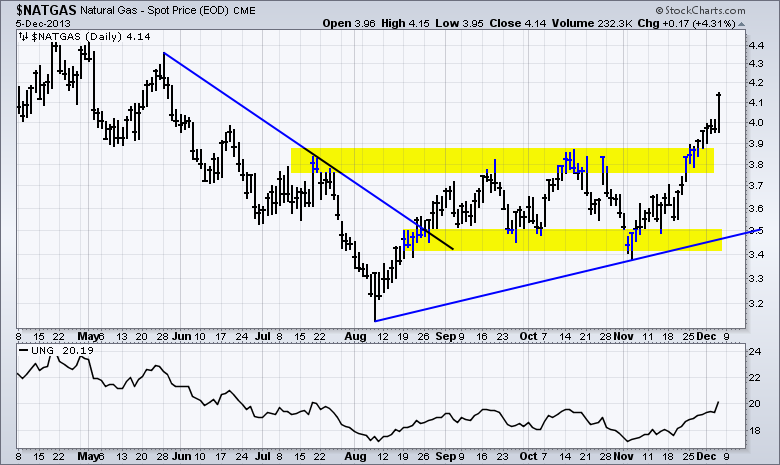
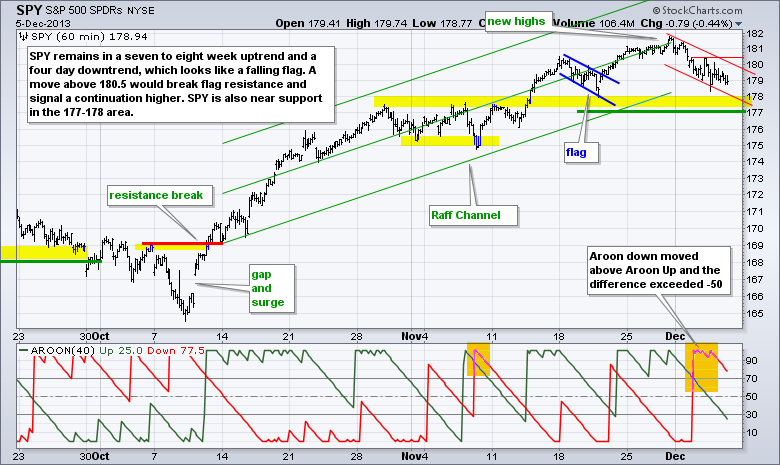
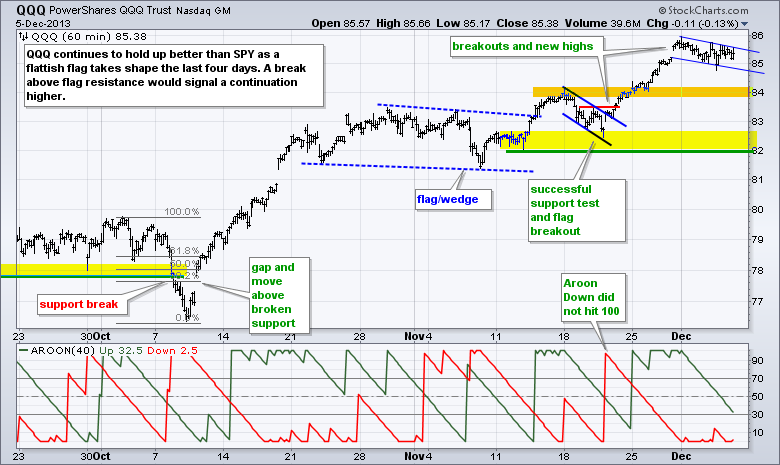
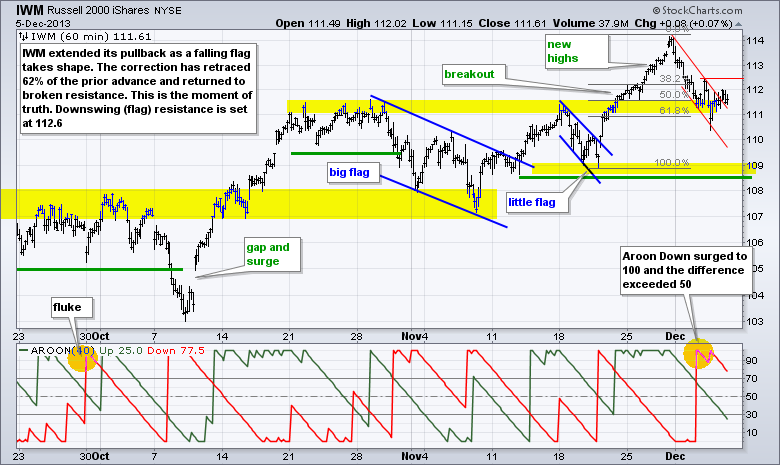
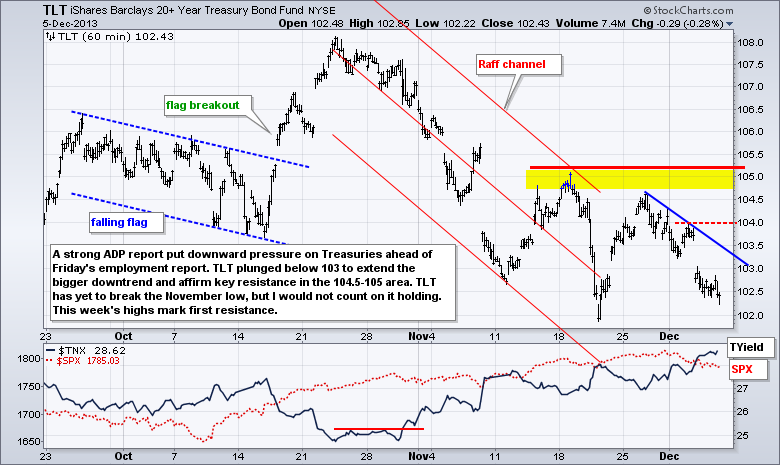
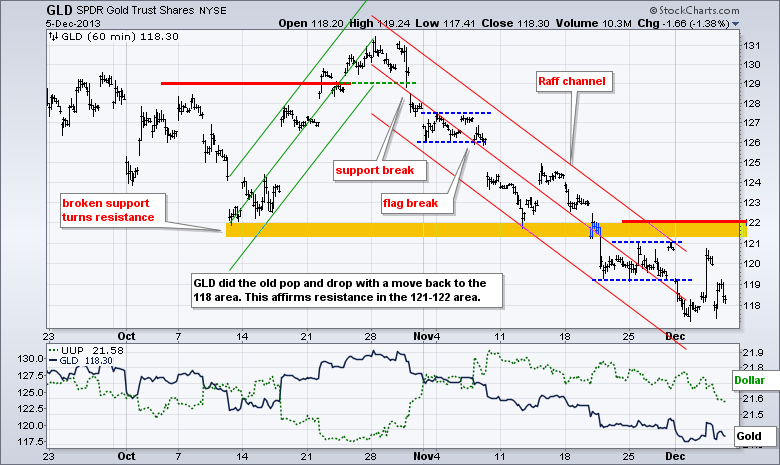
Stocks extended their corrective ways as the S&P 500 ETF (SPY) lost ground for the fifth consecutive day. Bespoke reports that 1996 was the last time the S&P 500 started December with a five day decline. Maybe so, but the index is down a mere 1.23% and this can hardly be classified as strong selling pressure. The decline has been very modest and even a bit mixed. The Tech SPDR (XLK) is still up over the last five days. The Semiconductor SPDR (XSD) is holding its wedge breakout and produced a modest gain on Wednesday. The Networking iShares (IGN) and Internet ETF (FDN) also edged higher. The Gold Miners SPDR (GDX) got hit hard as the Gold SPDR (GLD) fell back towards its prior lows. Natural Gas ($NATGAS) was one of the big winners with a 4.31% surge and move above $4 for the first time since early June. Also note that $NATGAS broke resistance from the Sep-Oct highs with this week's advance. Turning back to stocks, we could see some movement today after the release of the employment report. After big gains in November, a little indecision ahead of a key report is normal and the bigger trends remain up.
**This chart analysis is for educational purposes only, and should not
be construed as a recommendation to buy, sell or sell-short said securities**
**************************************************************
**************************************************************
**************************************************************
**************************************************************
***************************************************************
Key Reports and Events (all times Eastern):
Fri - Dec 06 - 08:30 - Employment Report
Fri - Dec 06 - 08:30 - Personal Income & Spending
Fri - Dec 06 - 09:55 - Michigan Sentiment
Fri - Dec 13 - 23:59 - Congressional Budget Deadline
Charts of Interest: Tuesday and Thursday
This commentary and charts-of-interest are designed to stimulate thinking. This analysis is not a recommendation to buy, sell, hold or sell short any security (stock ETF or otherwise). We all need to think for ourselves when it comes to trading our own accounts. First, it is the only way to really learn. Second, we are the only ones responsible for our decisions. Think of these charts as food for further analysis. Before making a trade, it is important to have a plan. Plan the trade and trade the plan. Among other things, this includes setting a trigger level, a target area and a stop-loss level. It is also important to plan for three possible price movements: advance, decline or sideways. Have a plan for all three scenarios BEFORE making the trade. Consider possible holding times. And finally, look at overall market conditions and sector/industry performance.

