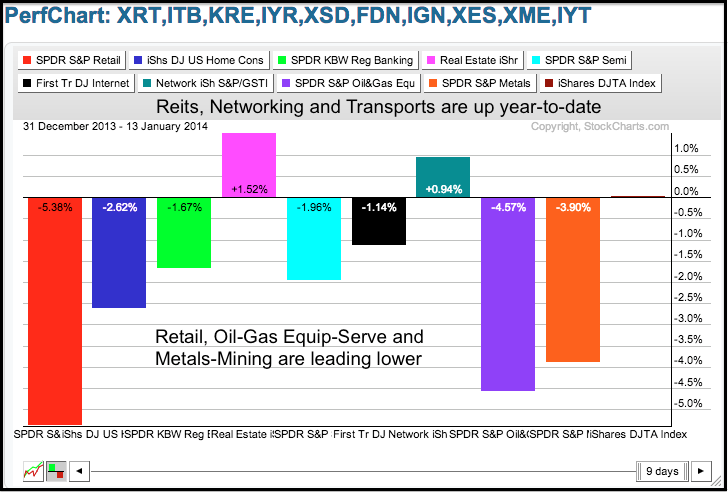
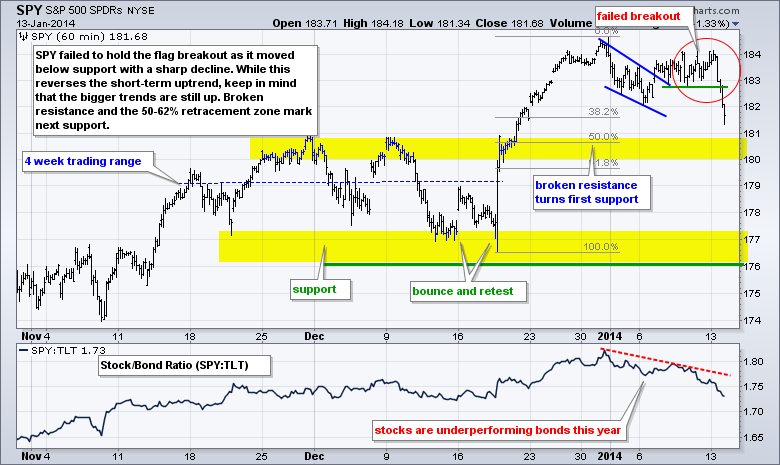
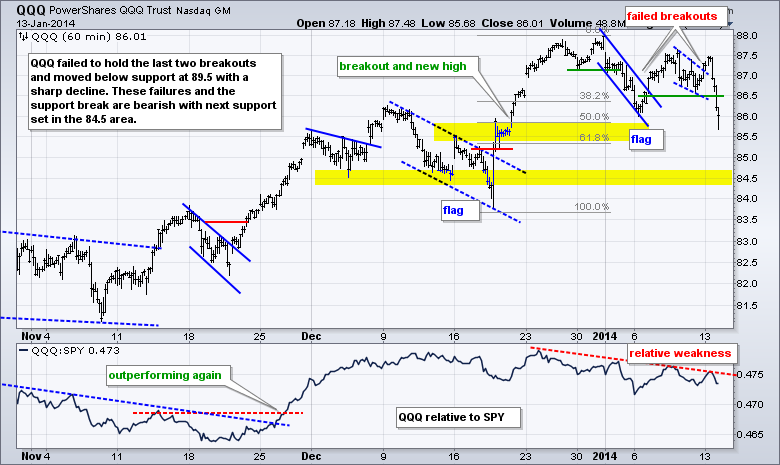
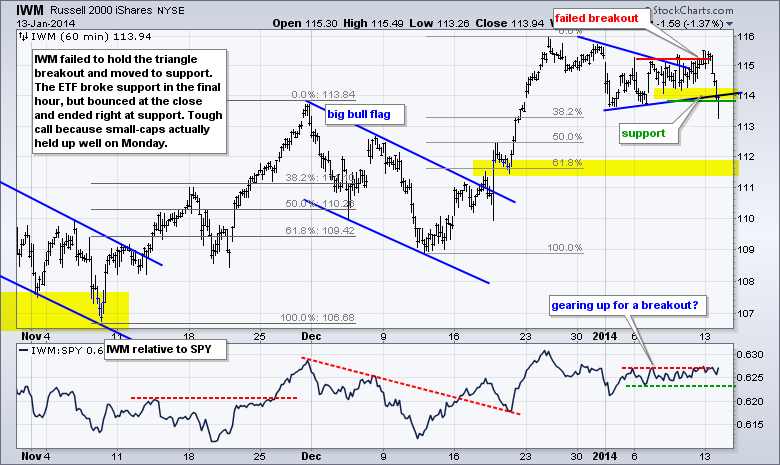
Stocks were hit with a broad-based selloff, but selling pressure was not that intense. The Russell 2000 ETF (IWM) led the way lower with a 1.05% decline and the Nasdaq 100 ETF (QQQ) held up the best with a .74% loss. All sectors were down with the Consumer Discretionary SPDR (XLY) and Energy SPDR (XLE) pacing the losses. XLY was hit with weakness in homebuilders and retail ahead of today's retail sales report. The Retail SPDR (XRT) fell over 2% and the Home Construction iShares (ITB) declined 2%. The Gold Miners ETF (GDX), Silver Miners ETF (SIL) and Copper Miners ETF (COPX) bucked the selling pressure as their respective metals advanced. Also note that the Networking iShares (IGN) held firm as Juniper and F5 surged. As the PerfChart below shows, IGN joins the REIT iShares (IYR) and Transport iShares (IYT) with year-to-date gains.
**This chart analysis is for educational purposes only, and should not
be construed as a recommendation to buy, sell or sell-short said securities**
**************************************************************
**************************************************************
**************************************************************
**************************************************************
***************************************************************
Key Reports and Events (all times Eastern):
Tue - Jan 14 - 08:30 - Retail Sales
Wed - Jan 15 - 07:00 - MBA Mortgage Index
Wed - Jan 15 - 08:30 - PPI
Wed - Jan 15 - 10:30 - Crude Inventories
Wed - Jan 15 - 14:00 - Fed's Beige Book
Thu - Jan 16 - 08:30 - Initial Claims
Thu - Jan 16 - 08:30 - CPI
Thu - Jan 16 - 10:00 - NAHB Housing Market Index
Thu - Jan 16 - 10:30 - Natural Gas Inventories
Fri - Jan 17 - 08:30 - Housing Starts/Building Permits
Fri - Jan 17 - 09:15 - Industrial Production
Fri - Jan 17 - 09:55 - Michigan Sentiment
Fri - Jan 17 - 10:00 - JOLTS - Job Openings
Charts of Interest: Tuesday and Thursday
This commentary and charts-of-interest are designed to stimulate thinking. This analysis is
not a recommendation to buy, sell, hold or sell short any security (stock ETF or otherwise).
We all need to think for ourselves when it comes to trading our own accounts. First, it is
the only way to really learn. Second, we are the only ones responsible for our decisions.
Think of these charts as food for further analysis. Before making a trade, it is important
to have a plan. Plan the trade and trade the plan. Among other things, this includes setting
a trigger level, a target area and a stop-loss level. It is also important to plan for three
possible price movements: advance, decline or sideways. Have a plan for all three scenarios
BEFORE making the trade. Consider possible holding times. And finally, look at overall market
conditions and sector/industry performance.

