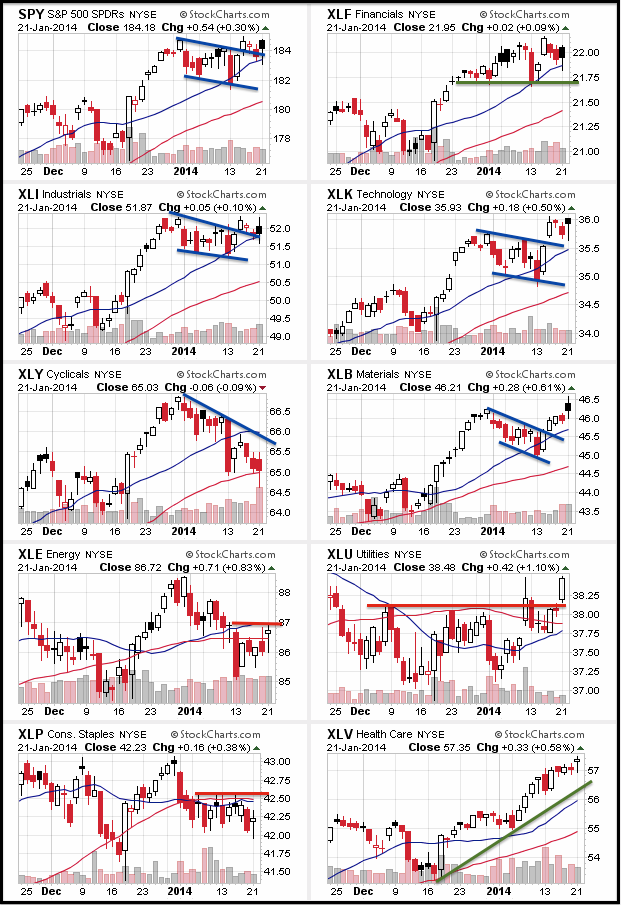
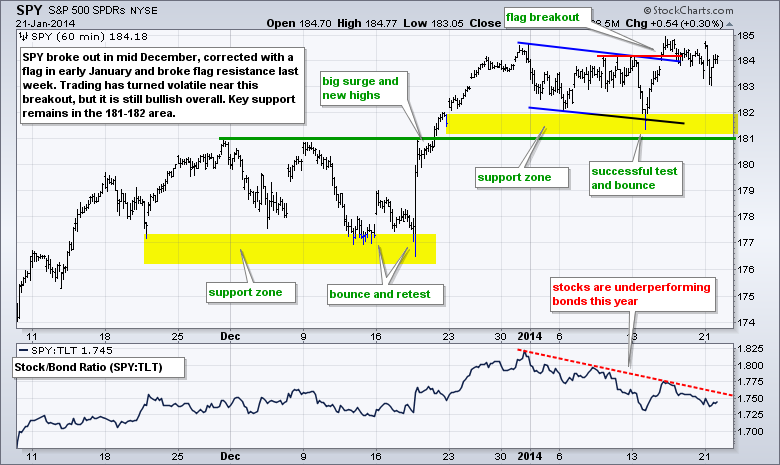
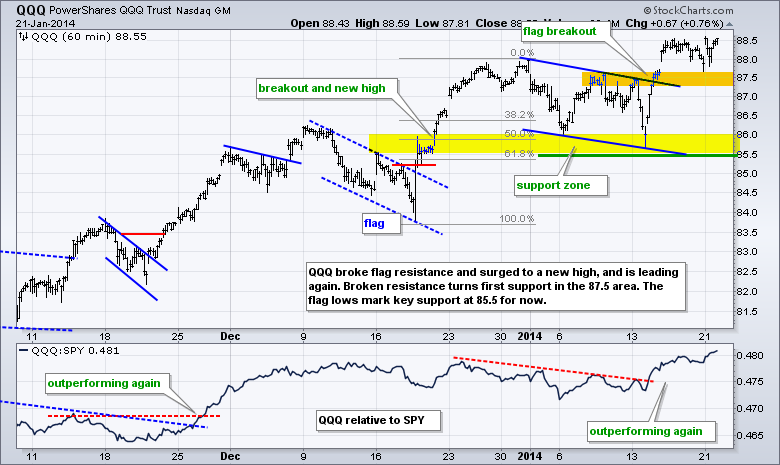
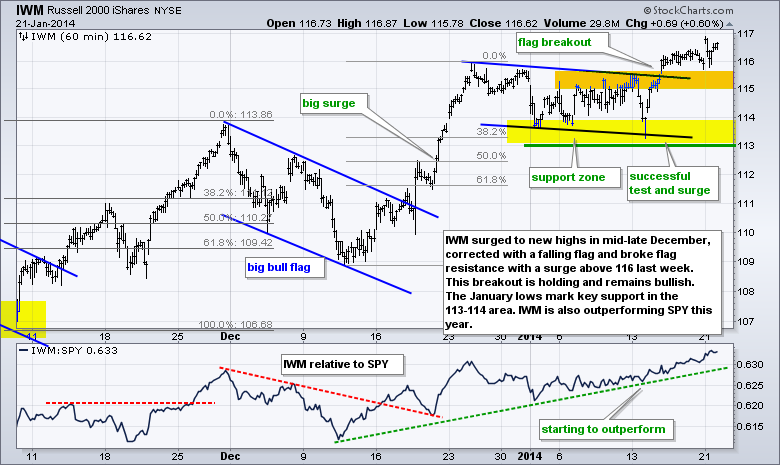
Stocks edged higher on Tuesday, which fits with the seasonal tendencies after a three day weekend in January. The Russell 2000 ETF (IWM) led the way with a .60% gain. The Dow Diamonds (DIA) lagged with a .21% loss though. Eight of the nine sectors were up with energy and utilities leading the way. The consumer discretionary sector lost ground as weakness in retailers and homebuilders weighed. Relative weakness in this key sector remains the biggest concern in the stock market right now. Regional banks were strong as the Regional Bank SPDR (KRE) surged over 2%. Note that the financial services sector is the biggest sector in the Russell 2000. The tech groups remained strong as the Networking iShares (IGN), Internet ETF (FDN) and Semiconductor SPDR (XSD) gained. IBM missed expectations after the close and is trading down around 3%. This, however, appears to be a stock specific issue and may not affect the tech sector as a whole. Earnings season remains in full swing with EBAY, FFIV, FIO, MSI, NFLX, TXT, USB and WDC set to report. A lot of tech companies in the mix here. As the CandleGlance charts below show, there are flag breakouts working for SPY, XLK, XLK and XLB. XLF is hold support. XLV is the strongest with a steep uptrend since mid December. XLU broke out with a big move. XLY, XLP and XLE remain the three laggards.
**This chart analysis is for educational purposes only, and should not
be construed as a recommendation to buy, sell or sell-short said securities**
**************************************************************
**************************************************************
**************************************************************
**************************************************************
***************************************************************
Key Reports and Events (all times Eastern):
Tue - Jan 22 - 07:00 - MBA Mortgage Index
Wed - Jan 23 - 08:30 - Initial Claims
Wed - Jan 23 - 09:00 - FHFA Housing Price Index
Wed - Jan 23 - 10:00 - Existing Home Sales
Wed - Jan 23 - 10:00 - Leading Indicators
Wed - Jan 23 - 10:30 - Natural Gas Inventories
Wed - Jan 23 - 11:00 - Crude Inventories
Charts of Interest: Tuesday and Thursday
This commentary and charts-of-interest are designed to stimulate thinking. This analysis is
not a recommendation to buy, sell, hold or sell short any security (stock ETF or otherwise).
We all need to think for ourselves when it comes to trading our own accounts. First, it is
the only way to really learn. Second, we are the only ones responsible for our decisions.
Think of these charts as food for further analysis. Before making a trade, it is important
to have a plan. Plan the trade and trade the plan. Among other things, this includes setting
a trigger level, a target area and a stop-loss level. It is also important to plan for three
possible price movements: advance, decline or sideways. Have a plan for all three scenarios
BEFORE making the trade. Consider possible holding times. And finally, look at overall market
conditions and sector/industry performance.

