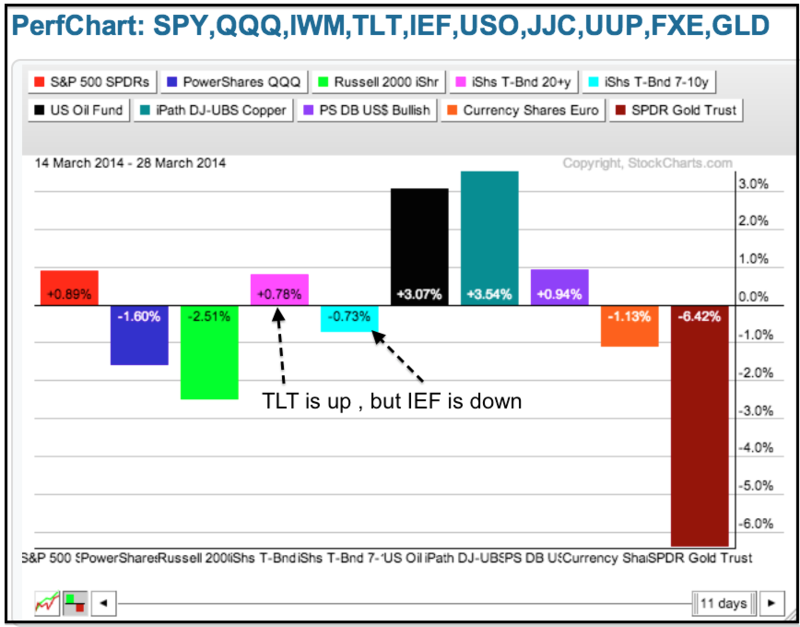
Programming Note: I will be at the MTA Symposium on Thursday and Friday, and Art's Charts will not be published on those days.
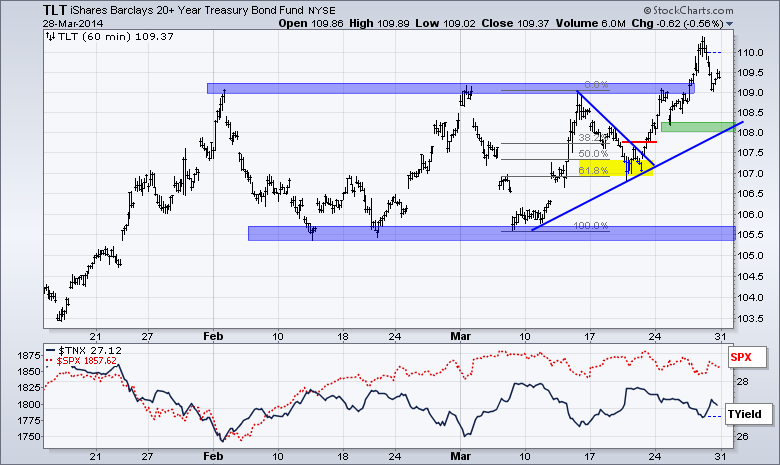
Stocks did the old pop-and-drop on Friday and finished the day mostly higher. Overall, it was a tale of two markets with the S&P 500 SPDR (SPY) and Equal-Weight S&P 500 ETF (RSP) holding support and extending their consolidations last week. The Russell 2000 ETF (IWM) and Nasdaq 100 ETF (QQQ), on the other hand, moved sharply lower as small-caps and momentum stocks were hit with selling pressure. The inter-market picture was also rather strange because Treasuries (TLT) and stocks (SPY) are both up over the last two weeks. This indicates that SPY and TLT, stocks and Treasuries, were positively correlated in the second half of March. These two have been negatively correlated for most of the last two years and something may need to give here. This week may mark an inflection point because there are several important economic reports on deck. Note that TLT broke out, but the 7-10 YR T-Bond ETF (IEF) has yet to follow suit and confirm. Positive economic numbers this week would likely trigger selling pressure in Treasuries, and this could negate the breakout in TLT. I still think the cup is half full for the economy and expect reports to be more positive than negative. This applies to Friday's non-farm payrolls because weekly jobless claims have been falling steadily this year.
**This chart analysis is for educational purposes only, and should not
be construed as a recommendation to buy, sell or sell-short said securities**
**************************************************************
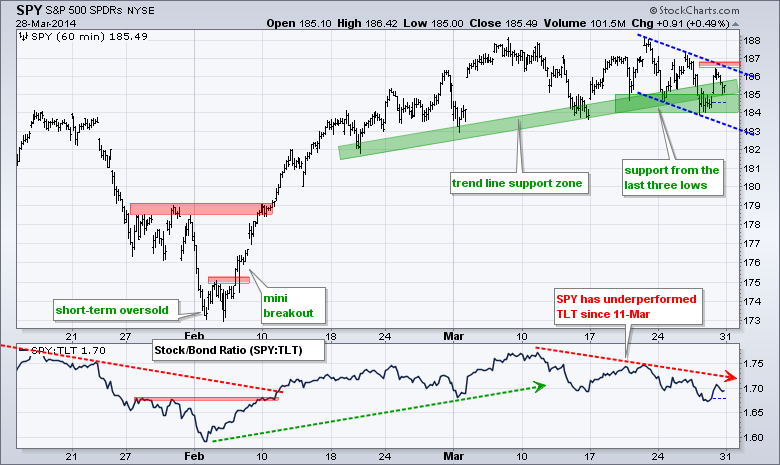
SPY continues to toy with support in the 184-185 area. Support here stems from the trend line zone and the lows of the last two weeks. Price action since the 21-Mar high at 188 is sloping down in a zigzag fashion. A break above 187 would provide the first signal that this consolidation is ending and the prior advance is continuing. I am concerned that SPY is underperforming TLT since 11-Mar and a support break at 184 would reverse the short-term uptrend. As far as the price relative (SPY:TLT ratio), a break above last week's high would signal a return to relative strength for SPY and be quite positive for stocks.
**************************************************************
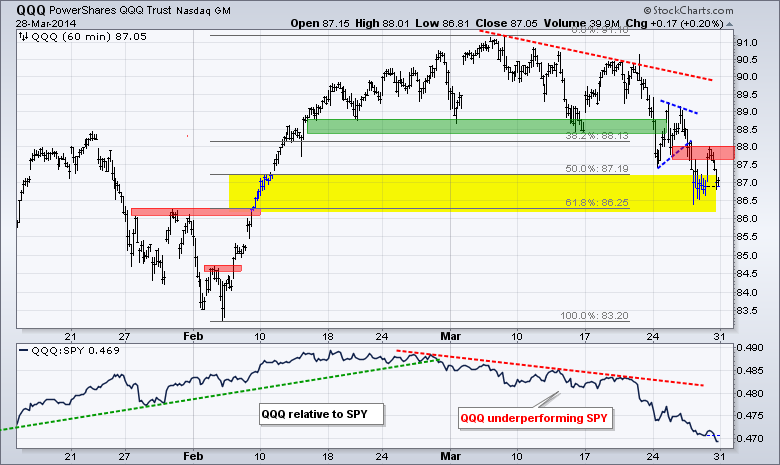
QQQ remains in a short-term downtrend and shows relative weakness, but the ETF is at an interesting juncture marked by the 50-62% retracement zone and broken resistance. This support zone is where one might expect a reversal and resumption of the bigger uptrend. The trend line zone and Friday's high combine to mark first resistance around 88.
**************************************************************
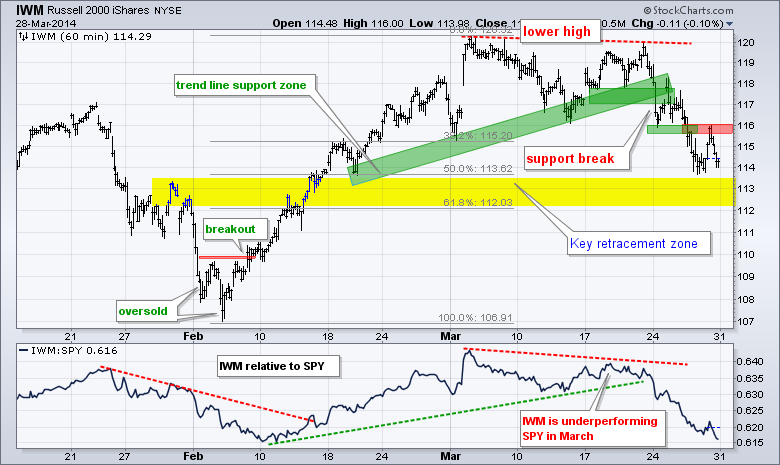
IWM remains in a short-term downtrend and shows relative weakness, but the ETF is also at an interesting juncture marked by the 50-62% retracement zone and broken resistance (yellow area). Broken support from the mid March low and Friday's high mark first resistance.
**************************************************************
The 20+ YR T-Bond ETF (TLT) broke resistance with a big surge and then fell back to broken resistance. The trend line zone and last week's low mark upswing support in the 108-108.5 area. A move below 108 would negate the breakout, which would be bearish for Treasuries and bullish for stocks. The employment report looms on Friday and jobless claims are at their lowest levels of the year. In a rather interesting twist, notice that the 10-YR Treasury Yield ($TNX) did not confirm the breakout in TLT. Interest rates move opposite of Treasuries and $TNX should have broken support to confirm the resistance break in TLT. I will, therefore, be watching $TNX closely this week.
**************************************************************
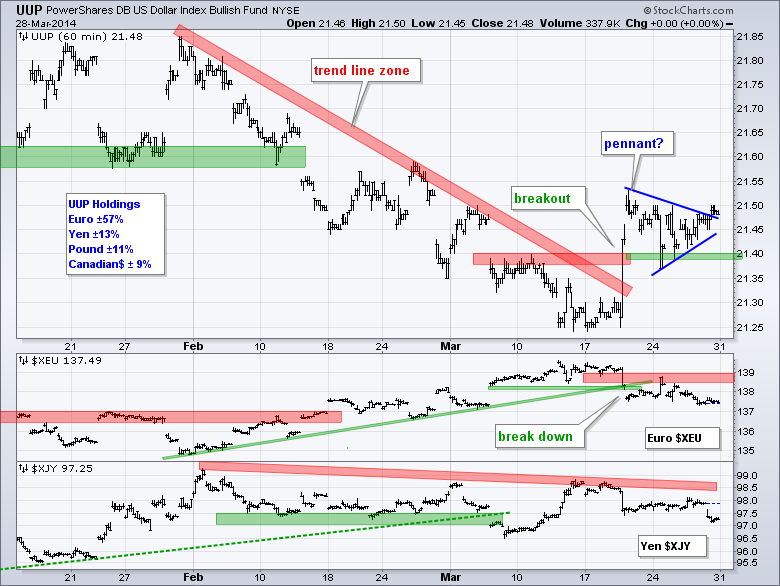
The US Dollar ETF (UUP) is making a breakout bid as the Euro remains soft ahead of this week's European Central Bank (ECB) meeting. Signs of disinflation appeared in Europe last week and this could prompt the ECB to pursue some WE, which would weigh on the Euro. Keep in mind, however, that the ECB is one of the tightest central banks in the world and has yet to give into QE. A policy change, therefore, would be a true watershed event. Overall, UUP is holding the breakout at 21.40 and this area turned into support. I will stay with a bullish bias as long as 21.35 holds in UUP and the Euro remains below 139.
**************************************************************
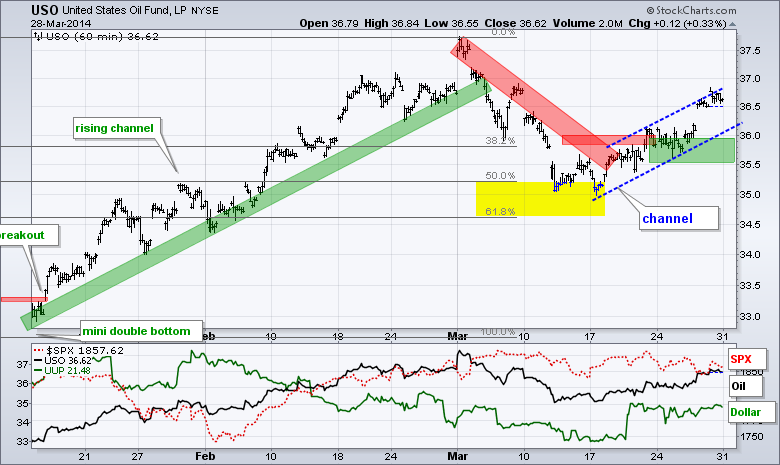
The USO Oil Fund (USO) extended its short-term uptrend with a move above 36.5 last week. The lower trend line and last week's lows combine to mark support in the 35.5-36 area. Oil is showing resilience and energy stocks are strong as XLE and XES hit new highs last week.
**************************************************************
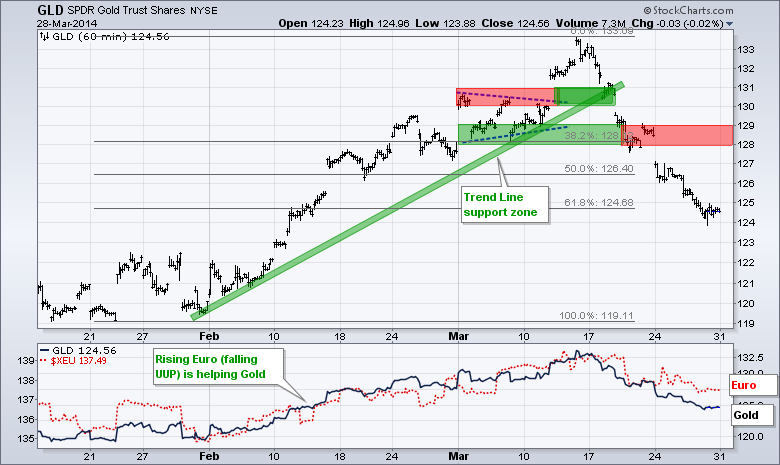
Gold remains in the doldrums as the employment picture improves, quantitative easing winds down and Fed fund futures price in future rate hikes. GLD is down over 6% from its high and still shows no signs of firming. Even though gold is oversold and ripe for a bounce, further weakening in the Euro could keep downward pressure on the yellow metal. Broken support in the 128-129 area turns into first resistance.
***************************************************************
Key Reports and Events (all times Eastern):
Mon - Mar 31 - 09:45 - Chicago PMI
Tue - Apr 01 - 10:00 - ISM Manufacturing Index
Tue - Apr 01 - 10:00 - Construction Spending
Tue - Apr 01 - 14:00 - Auto Sales/Truck Sales
Wed - Apr 02 - 07:00 - MBA Mortgage Index
Wed - Apr 02 - 08:15 - ADP Employment Report
Wed - Apr 02 - 10:00 - Factory Orders
Wed - Apr 02 - 10:30 - Crude Oil Inventories
Thu - Apr 03 - 07:30 - Challenger Job Report
Thu - Apr 03 - 08:30 - Initial Jobless Claims
Thu - Apr 03 - 10:00 - ISM Services Index
Thu - Apr 03 - 10:30 - Natural Gas Inventories
Fri - Apr 04 - 08:30 - Employment Report
This commentary and charts-of-interest are designed to stimulate thinking. This analysis is
not a recommendation to buy, sell, hold or sell short any security (stock ETF or otherwise).
We all need to think for ourselves when it comes to trading our own accounts. First, it is
the only way to really learn. Second, we are the only ones responsible for our decisions.
Think of these charts as food for further analysis. Before making a trade, it is important
to have a plan. Plan the trade and trade the plan. Among other things, this includes setting
a trigger level, a target area and a stop-loss level. It is also important to plan for three
possible price movements: advance, decline or sideways. Have a plan for all three scenarios
BEFORE making the trade. Consider possible holding times. And finally, look at overall market
conditions and sector/industry performance.

