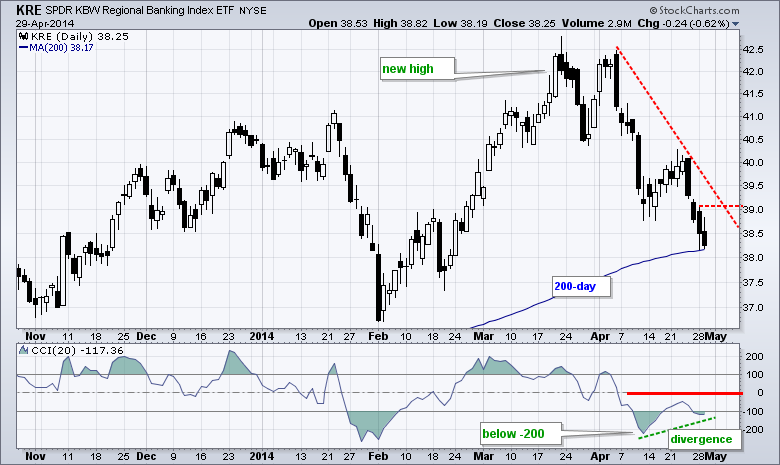
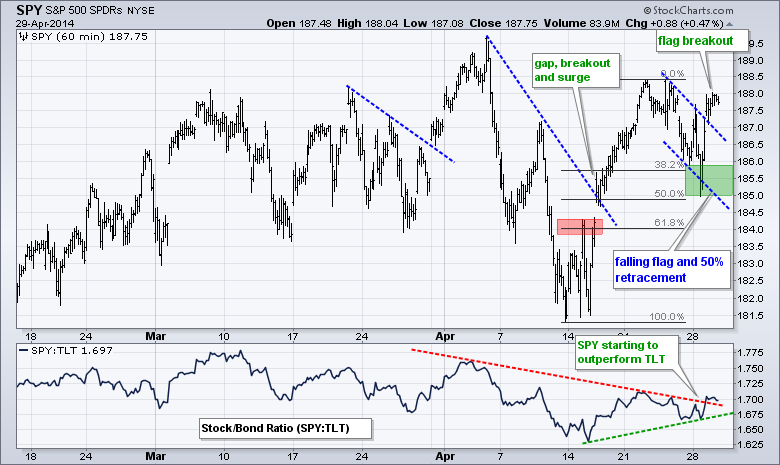
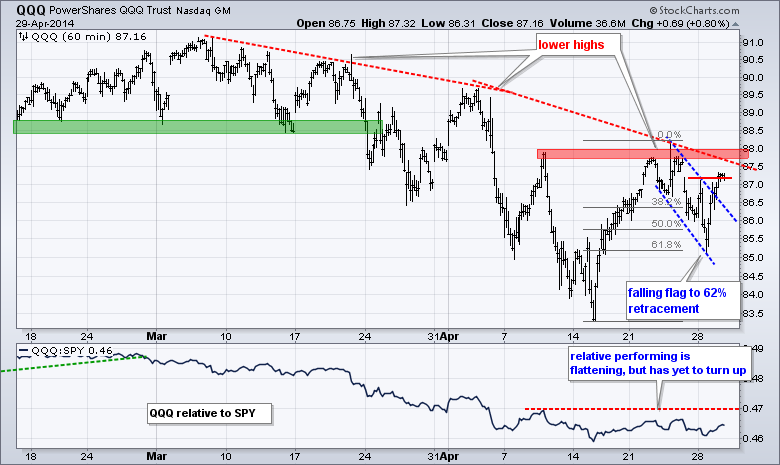
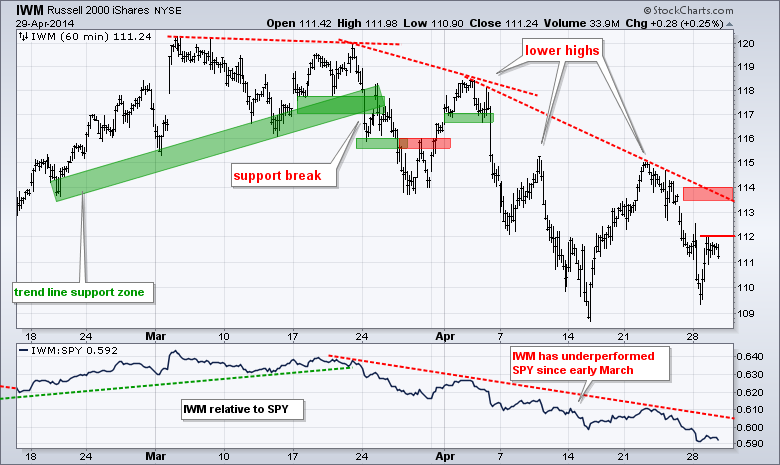
The major index ETFs closed with small gains as the market treaded water ahead of today's FOMC statement. These gains were enough to produce flag breakouts in QQQ and SPY. IWM remains in a downtrend and small-caps continue to hold the market back. Some of the beaten-down high-beta names rallied as the Internet ETF (FDN) surged over 2% and the Biotech SPDR (XBI) gained over 3%. The Regional Bank SPDR (KRE) remained a laggard with a .62% loss. Financial services is the largest sector in the Russell 2000 and relative weakness in regional banks is a big reason for relative weakness in small-caps. KRE hit a new high just six weeks ago and the ETF is now testing its rising 200-day moving average. Also notice that the Commodity Channel Index (CCI) dipped below -200 in mid April and is holding in the -100 area now. A small bullish divergence is brewing. This is interesting because KRE is at the 200-day and oversold. A break above zero in CCI would turn momentum bullish.
**This chart analysis is for educational purposes only, and should not
be construed as a recommendation to buy, sell or sell-short said securities**
**************************************************************
SPY continues to trade better than IWM and QQQ. SPY surged above 188 in late April and then corrected with a falling flag that retraced 50%. The ETF broke flag resistance with a surge on Tuesday and then consolidated above this breakout. I will set short-term support at 185. The indicator window shows the SPY:TLT ratio forming a higher low over the last two weeks and breaking above the April trend line. This break is still relatively young, but relative strength in stocks (versus Treasuries) would be positive.
**************************************************************
QQQ remains in a downtrend overall, but the ETF managed to reverse off the 62% retracement and break the flag trend line with a surge above 87. Resistance at 88 remains in place and follow thru above this level would completely reverse the two month downtrend.
**************************************************************
IWM remains in a downtrend and relatively weak. The ETF peaked in early March and fell throughout April. This decline could be a correction within a bigger uptrend, but IWM needs to break the sequence of lower lows and lower highs to fully reverse this downtrend. Look for a break above 114 to provide the first sign of a trend reversal.
**************************************************************
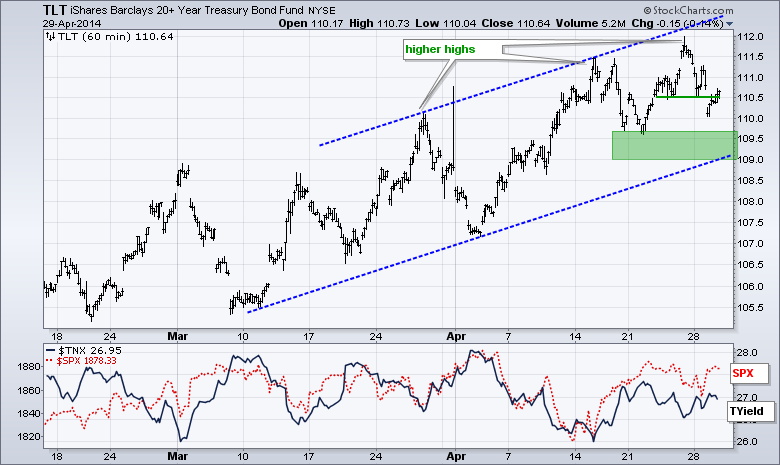
No change. The 20+ YR T-Bond ETF (TLT) surged to a new reaction high with the intraday move to 112 on Friday. This move extends the uptrend in Treasuries as we head into the employment report on Friday. The bond market is pricing in bad economic news this week so anything positive would likely weigh on Treasuries. On the price chart, last week's lows and the lower trend line of the rising channel mark uptrend support at 109.
**************************************************************
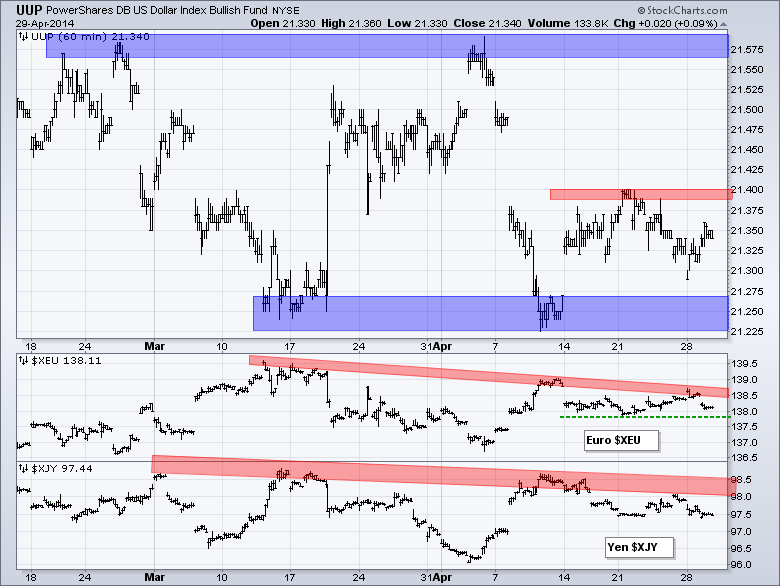
The Dollar remains range bound since mid February with support in the 21.2 area and resistance in the 21.6 area. UUP did surge off support, but we have yet to see follow through with a mini-breakout at 21.40. The Dollar may cue on the Fed and economic data. Further tapering and stronger economic data would be Dollar positive. Euro zone inflation rose from .5 to .7 percent in April. While below expectations, it is still a rise and this is Euro positive.
**************************************************************
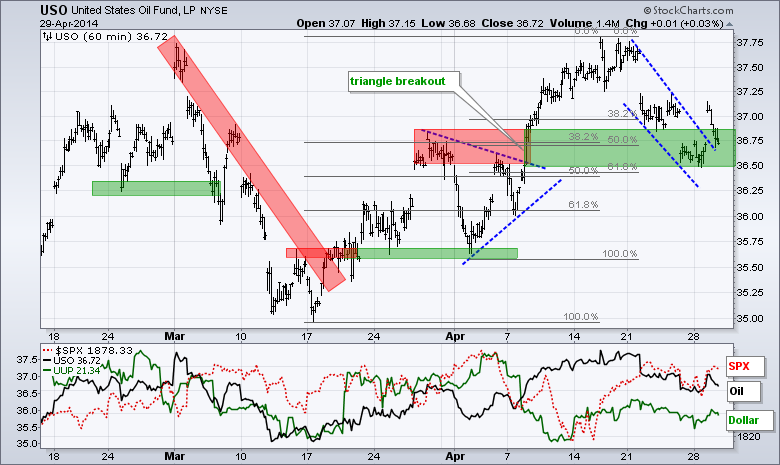
The USO Oil Fund (USO) surged from 35 to 37.75 and then corrected with a falling wedge or flag. This correction returned to broken resistance and the Fibonacci cluster zone. USO bounced off this zone on Tuesday and broke wedge resistance, but fell back after a strong open. A support break at 36.5 would put the downswing back in play.
**************************************************************
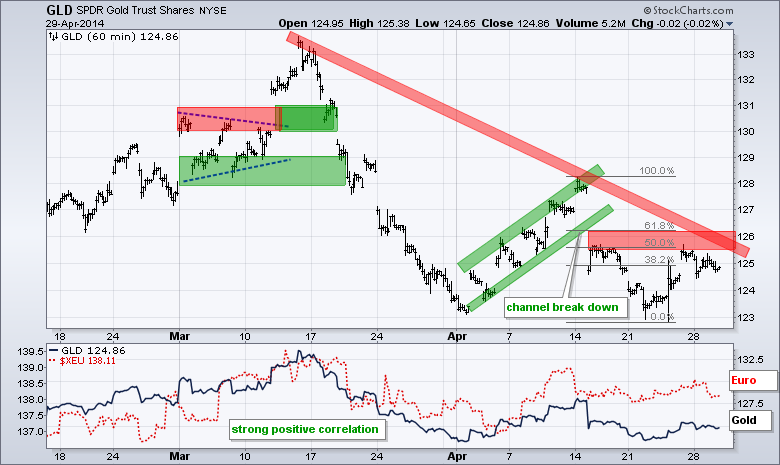
This could be a big week for bullion. The Gold SPDR (GLD) remains in a downtrend, but I am lowering short-term resistance to the 126.2 level. The mid March trend line and recent highs mark resistance here. A breakout would provide the first clue that gold wants to move higher. Watch the 10-YR Treasury Yield ($TNX) for clues as well. A rise in yields would be negative for gold, while a decline would be positive.
***************************************************************
Key Reports and Events (all times Eastern):
Wed - Apr 30 - 07:00 - MBA Mortgage Index
Wed - Apr 30 - 08:15 - ADP Employment Report
Wed - Apr 30 - 08:30 - GDP
Wed - Apr 30 - 09:45 - Chicago PMI
Wed - Apr 30 - 10:30 - Crude Oil Inventories
Wed - Apr 30 - 14:00 - Fed Policy Statement
Thu - May 01 - 07:30 - Challenger Job Report
Thu - May 01 - 08:30 - Initial Jobless Claims
Thu - May 01 - 08:30 - Personal Income & Spending
Thu - May 01 - 10:00 - ISM Manufacturing Index
Thu - May 01 - 10:00 - Construction Spending
Thu - May 01 - 10:30 - Natural Gas Inventories
Thu - May 01 - 14:00 - Auto-Truck Sales
Fri - May 02 - 08:30 - Employment Report
Fri - May 02 - 10:00 - Factory Orders
This commentary and charts-of-interest are designed to stimulate thinking. This analysis is not a recommendation to buy, sell, hold or sell short any security (stock ETF or otherwise). We all need to think for ourselves when it comes to trading our own accounts. First, it is the only way to really learn. Second, we are the only ones responsible for our decisions. Think of these charts as food for further analysis. Before making a trade, it is important to have a plan. Plan the trade and trade the plan. Among other things, this includes setting a trigger level, a target area and a stop-loss level. It is also important to plan for three possible price movements: advance, decline or sideways. Have a plan for all three scenarios BEFORE making the trade. Consider possible holding times. And finally, look at overall market conditions and sector/industry performance.

